In the aftermath of the global financial crisis and the Great Recession, research has sought to understand the behavior of house prices. A feature of all bubbles is the emergence of seemingly plausible fundamental arguments that attempt to justify the dramatic run-up in prices. Comparing the U.S. housing boom of the mid-2000s with ongoing Norwegian housing market trends again poses the question of whether a bubble can be distinguished from a rational response to fundamentals. Survey evidence on expectations about house prices can be useful for diagnosing a bubble.
In the aftermath of the global financial crisis and the Great Recession, research has sought to understand the behavior of house prices. Before 2007, countries with the largest increases in household debt relative to income experienced the fastest run-ups in house prices (Glick and Lansing 2010). Within the United States, house prices rose faster in areas where subprime and exotic mortgages were more prevalent (Mian and Sufi 2009, Pavlov and Wachter 2011). In a given area, house price appreciation had a significant positive impact on subsequent loan approval rates (Goetzmann, Peng, and Yen 2012).
Many studies have attributed the financial crisis of 2007–09 to a credit-fueled bubble in the housing market. The U.S. Financial Crisis Inquiry Commission (2011) emphasized the effects of a self-reinforcing feedback loop in which an influx of new homebuyers with access to easy mortgage credit helped fuel an excessive run-up in house prices. This, in turn, encouraged lenders to ease credit further on the assumption that house prices would continue to rise.
By contrast, to explain the boom, others have used theories in which house prices were driven mainly by fundamentals, such as low interest rates, restricted supply, demographics, or decreased perceptions of risk. This Economic Letter compares the U.S. housing market experience with ongoing trends in Norway, examining whether a bubble can be distinguished from a rational response to fundamentals. Survey evidence on people’s expectations about house prices can be useful in diagnosing a bubble.
Fundamentals versus a bubble
Following the 2001 recession, house prices in the United States and many other countries rose rapidly. Media attention soon focused on the possibility of a housing bubble. But Federal Reserve Chairman Alan Greenspan (2004) voiced skepticism: “Housing price bubbles presuppose an ability of market participants to trade properties as they speculate about the future. But upon sale of a house, homeowners must move and live elsewhere. This necessity, as well as large transaction costs, are significant impediments to speculative trading and an important restraint on the development of price bubbles.”
Nevertheless, it was widely accepted that Japan had experienced an enormous real estate bubble in the late 1980s. Large transaction costs may actually make bubbles more likely because pricing inefficiencies become difficult to exploit via arbitrage (Shiller 2007). Moreover, according to the National Association of Realtors, as much as 40% of U.S. residential sales during the mid-2000s were to buyers of vacation or investment homes for which there was no need to move and live elsewhere.
Indeed, possible housing speculation was discussed at the December 2004 Federal Open Market Committee meeting. Some participants noted “signs of potentially excessive risk-taking … [including] anecdotal reports that speculative demands were becoming apparent in the markets for single-family homes and condominiums.” Still, many economists and policymakers argued that fundamentals could explain U.S. housing market trends.
Can low risk premiums explain the run-up?
The fundamental value of an asset is typically measured by the present value of expected future cash or service flows accruing to the owner. Service flows from housing are called imputed rents. The discount rate used in the present value calculation is comprised of a risk-free yield and a compensation for perceived risk, i.e., a risk premium. Their sum defines the rate of return that the investor expects to receive on the asset. All else equal, a lower risk premium or a lower risk-free yield implies a lower expected return and a lower discount rate in the present-value calculation. Future service flows will be discounted less and the fundamental value will rise.
A recent paper (Favilukis, Ludvigson, and Van Nieuwerburgh 2012) argues that the run-up in U.S. house prices relative to rents was largely due to a financial market liberalization that reduced buyers’ perception of the riskiness of housing. The authors develop a theoretical model where easier lending standards and lower mortgage transaction costs contribute to a substantial rise in house prices relative to rents. But this is not a bubble. Rather, the financial market liberalization allows rational households to better smooth their consumption in the face of unexpected income declines, thus reducing their perception of economic risk. Lower risk perception induces households to accept a lower rate of return on the purchase of risky assets such as houses. A lower expected return leads to an increase in the model’s fundamental price-rent ratio. “[F]inancial market liberalization drives price-rent ratios up because it drives risk premiums down…. Procyclical increases in [fundamental] price-rent ratios reflect rational expectations of lower future returns” (Favilukis, et al. 2012).
Similarly, Cochrane (2011) argues, “Crying bubble is empty unless you have an operational procedure for distinguishing them from rationally low risk premiums.”
Bubble evidence: High expected returns near market peak
One way that a bubble might be distinguished from a situation with rationally low risk premiums is to examine investor expectations about returns. Rational investors with low risk premiums would expect low returns after a sustained price run-up. By contrast, irrationally exuberant bubble investors would expect high returns because they simply extrapolate recent price movements into the future. Survey data from both stock and real estate markets confirm that investor expectations tend to be extrapolative. Overall, the evidence appears to contradict the view that low risk premiums and low expected returns explained the run-up in U.S. house prices relative to rents.
Shiller (2000) developed a questionnaire to study investor expectations about future stock market returns in Japan and the United States during the 1990s. From the data, he constructed an index of “bubble expectations,” that is, the belief that stock prices would continue to rise despite being high relative to fundamentals. He found that the index moved roughly in line with movements in the stock market itself, suggesting that investors tend to extrapolate recent market trends when making predictions about future returns.
Fisher and Statman (2002) and Vissing-Jorgenson (2004) also found evidence that U.S. stock market investors extrapolated recent market trends during the late 1990s and early 2000s. Using survey data, they discovered that investors who experienced high portfolio returns in the past tend to expect higher returns in the future. Moreover, expected returns reached a maximum just when the stock market itself reached a peak in early 2000.
Using survey data on homebuyers in four metropolitan areas in 2002 and 2003, Case and Shiller (2003) found that about 90% of respondents expected house prices to increase over the next several years. More strikingly, when asked about the next ten years, respondents expected annual price appreciation in the range of 12 to 16% per year—implying a tripling or quadrupling of home values during the coming decade.
In a study of data from the Michigan Survey of Consumers, Piazzesi and Schneider (2009) report that “starting in 2004, more and more households became optimistic after having watched house prices increase for several years.” Anecdotal evidence further supports the view that U.S. housing investors had high expected returns near the market peak. The June 6, 2005, cover of Fortune magazine was titled “Real Estate Gold Rush—Inside the hot-money world of housing speculators, condo-flippers and get-rich-quick schemers.” One week later, the June 13, 2005, cover of Time magazine was titled “Home $weet Home—Why we’re going gaga over real estate.” Both covers depicted celebrating housing investors—suggesting a rosy outlook for U.S. real estate.
In 2006 and 2007 surveys, Shiller (2007) found that places with high recent house price growth exhibited high expectations of future price appreciation, while places with slowing price growth exhibited downward shifts in expected appreciation. Indeed, by 2008, with the housing market bust well under way, Case and Shiller (2010) found that survey respondents in prior boom areas now mostly expected declines in future house prices.
Figure 1
Real house price index

Sources: Shiller (2005) and Eitrheim and Erlandsen (2004, 2005).
Figure 2
Ratio of house price to rent

Sources: Norges Bank and Lincoln Institute of Land Policy.
Figure 3
Ratio of household debt to disposable income

Sources: Norges Bank and FRB St. Louis.
Figure 4
Norwegian household expectations for home prices

Source: Financial Supevisory Authority of Norway.
Applying U.S. lessons to Norway
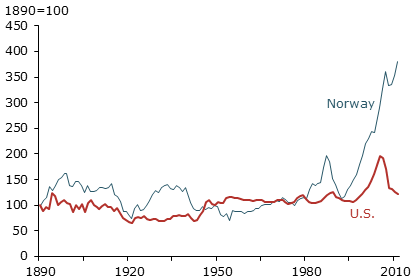
Lessons learned from the United States may help determine whether housing bubbles exist elsewhere. Norway is an instructive case. Figure 1 plots real house prices in the United States and Norway from 1890 to 2011. It shows that real house prices were relatively stagnant in both countries for most of the 20th century. Norway and other Scandinavian countries experienced a major house price boom in the late 1980s, followed by a crash in the early 1990s. The crash triggered a financial crisis throughout Scandinavia, resulting in numerous bank failures (see Allen and Gale 1999). Interestingly, this earlier boom-bust pattern in Norway is similar in magnitude to the recent pattern in U.S. house prices. After peaking in 2006, U.S. real house prices have dropped nearly 40%. Starting in the late 1990s, Norwegian house prices experienced another major boom, but so far no bust. On the contrary, real house prices in Norway have risen nearly 30% since 2006.
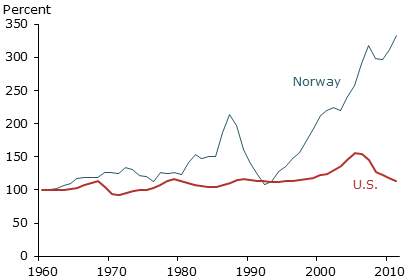
Figure 2 plots price-rent ratios in the United States and Norway since 1960. The U.S. ratio peaked in early 2006, but has since fallen to its preboom level. The price-rent ratio for Norway has continued to trend upwards and currently stands about 50% above its last major peak achieved two decades ago.
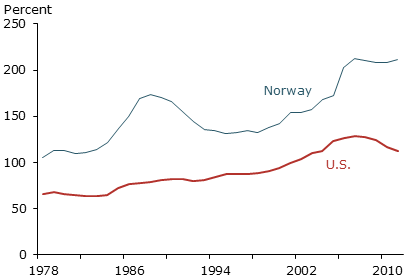
Figure 3 compares household leverage ratios in the two countries. The U.S. ratio of household debt to disposable personal income peaked at about 130% in 2007. The leverage ratio in Norway has risen dramatically over the past decade and currently stands at around 210%.
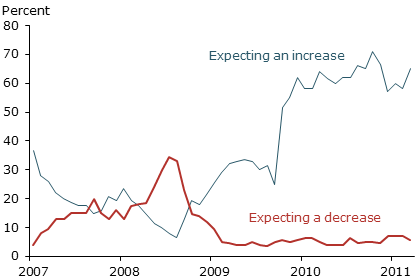
Recent Norwegian housing market trends have raised concerns about financial stability. The Central Bank of Norway (2012) identifies the household sector as having a high level of risk or vulnerability to shocks. A report by Norway’s Financial Supervisory Authority (FSA) (2012) emphasized the risks posed by growing debt burdens relative to incomes, high loan-to-value ratios, greater recourse to interest-only borrowing, and a widespread belief among Norwegians that house prices will continue to rise. Figure 4 plots the results of a recent FSA survey. It shows that the percentage of Norwegian households that believe property prices will keep rising over the next year has gone from a low of 10% in 2008 to around 70% in 2011. Like U.S. housing investors, Norwegians appear to expect high returns on housing even after a sustained run-up in the price-rent ratio. This is directly at odds with the idea of rationally low risk premiums, but is consistent with investor behavior during bubbles.
In a report issued earlier this year, the International Monetary Fund (2012) concluded “[F]undamentals appear to explain part, but not all, of the house price boom in Norway. In particular, fundamentals such as higher income, population growth, and tax changes have all boosted demand. Additional pressures on prices have come from the slow adjustment of supply. However, nonfundamental factors such as optimistic price expectations—which are unlikely to be sustainable and could change quickly—have also played a role…. On balance, model-based estimates…suggest that Norwegian residential property prices may be misaligned by 15 to 20%.”
Conclusion
Speculative bubbles have occurred in numerous countries and asset markets (see Lansing 2007). A common feature of all bubbles is the emergence of seemingly plausible fundamental arguments that attempt to justify the dramatic run-up in asset prices. One such argument cited to justify the recent U.S. house price boom posits a decline in the risk premium of rational investors. However, a variety of evidence showing that investors typically expect high future returns near market peaks seems to clearly refute this explanation.
History tells us that episodes of sustained rapid credit expansion combined with booming asset prices are almost always followed by periods of financial stress (Borio and Lowe 2002, Riiser 2005). This was certainly true for the U.S. housing market of the mid-2000s. Time will tell whether things turn out differently for the Norwegian housing market.
References
Allen, Franklin, and Douglas Gale. 1999. “Bubbles, Crises, and Policy.” Oxford Review of Economic Policy 15(3),pp. 9–18.
Borio, Claudio, and Philip Lowe. 2002. “Asset Prices, Financial and Monetary Stability: Exploring the Nexus.” Bank for International Settlements Working Paper 114.
Case, Karl, and Robert Shiller. 2003. “Is There a Bubble in the Housing Market?” Brookings Papers on Economic Activity 1, pp. 299–362.
Case, Karl, and Robert Shiller. 2010. “What Were They Thinking? Home Buyer Behavior in Hot and Cold Markets.” Working Paper.
Central Bank of Norway. 2012. “Financial Stability Report 1/2012.” May.
Cochrane, John H. 2011. “How Did Paul Krugman Get It So Wrong?” Economic Affairs 31(2), pp. 36–40.
Eitrheim, Øyvind, and Solveig Erlandsen. 2004. “House Price Indices for Norway, 1819–2003.” Norges Bank Occasional Paper 35, Chapter 9.
Eitrheim, Øyvind, and Solveig Erlandsen. 2005. “House Prices in Norway 1819–1989.” Scandinavian Economic History Review 53, pp. 7–33.
Favilukis, Jack, Sydney Ludvigson, and Stijn Van Nieuwerburgh. 2012. “The Macroeconomic Effects of Housing Wealth, Housing Finance, and Limited Risk-Sharing in General Equilibrium.” New York University Working Paper.
Federal Open Market Committee. 2004. “Minutes.” Federal Reserve Board of Governors, December 14.
Financial Supervisory Authority of Norway. 2012. “Risk Outlook 2012: The Financial Market in Norway.” March 13.
Fisher, Kenneth, and Meir Statman. 2002. “Blowing Bubbles.” Journal of Psychology and Financial Markets 3, pp. 53-65.
Glick, Reuven, and Kevin Lansing. 2010. “Global Household Leverage, House Prices, and Consumption.” FRBSF Economic Letter 2010-01 (January 11).
Goetzmann, William, Liang Peng and Jacqueline Yen. 2012. “The Subprime Crisis and House Price Appreciation.” Journal of Real Estate Finance and Economics 44, pp. 36–56.
Greenspan, Alan. 2004. “The Mortgage Market and Consumer Debt.” Remarks at America’s Community Bankers Annual Convention, Washington DC, October 19.
International Monetary Fund. 2012. “Norway: Staff Report for the 2011 Article IV Consultation.” January 13.
Lansing, Kevin. 2007. “Asset Price Bubbles.” FRBSF Economic Letter 2007-32 (October 26).
Mian, Atif, and Amir Sufi. 2009. “The Consequences of Mortgage Credit Expansion: Evidence from the U.S. Mortgage Default Crisis.” Quarterly Journal of Economics 124, pp. 1449–1496.
Pavlov, Andrey, and Susan Wachter. 2011. “Subprime Lending and Real Estate Prices.” Real Estate Economics 39, pp. 1–17.
Piazzesi, Monika, and Martin Schneider. 2009. “Momentum Traders in the Housing Market: Survey Evidence and a Search Model.” American Economic Review Papers and Proceedings 99, pp. 406–411.
Riiser, Magdalena. 2005 “House Prices, Equity Prices, Investment, and Credit: What Do They Tell Us about Banking Crises? A Historical Analysis Based on Norwegian Data.” Central Bank of Norway Economic Bulletin, 76(3), pp. 145–154.
Shiller, Robert. 2000. “Measuring Bubble Expectations and Investor Confidence.” Journal of Psychology and Financial Markets 1, pp. 49–60.
Shiller, Robert. 2005. Irrational Exhuberence, 2nd Edition. Princeton NJ: Princeton University Press. Updated data from http://www.econ.yale.edu/~shiller/data.htm
Shiller, Robert. 2007. “Understanding Recent Trends in House Prices and Homeownership.” Paper presented at Symposium sponsored by FRB Kansas City, Jackson Hole, WY.
U.S. Financial Crisis Inquiry Commission. 2011. “The Financial Crisis Inquiry Report.” Final Report of the National Commission on the Causes of the Financial and Economic Crisis in the United States.
Vissing-Jorgensen, Annette. 2004. “Perspectives on Behavioral Finance: Does ‘Irrationality’ Disappear with Wealth? Evidence from Expectations and Actions.” In NBER Macroeconomics Annual 2003, eds. M. Gertler and K. Rogoff. Cambridge, MA: MIT Press, pp. 139–194.
Opinions expressed in FRBSF Economic Letter do not necessarily reflect the views of the management of the Federal Reserve Bank of San Francisco or of the Board of Governors of the Federal Reserve System. This publication is edited by Anita Todd and Karen Barnes. Permission to reprint portions of articles or whole articles must be obtained in writing. Please send editorial comments and requests for reprint permission to research.library@sf.frb.org