
The federal debt as a share of U.S. GDP is nearing its historical high from World War II. This ratio fell sharply over the three decades after World War II due to a primary surplus, rapid economic growth, and low interest rates. Projections for the coming three decades point to a persistent primary deficit without major reforms to mandatory spending programs or higher taxes. Thus, the rates of interest and economic growth will be crucial for determining the long-run debt-to-GDP ratio’s evolution.
The U.S. federal debt is now roughly as large as the country’s annual GDP. A high and rising ratio of debt to GDP not only raises government borrowing costs but also risks pushing up long-run interest rates, which in turn can reduce investment and economic growth. The last time the debt as a share of GDP was this large was in 1945–1946, at the end of World War II (WWII). Over the following three decades, the debt-to-GDP ratio steadily fell, reaching roughly 25% by 1975. That 30-year decline contrasts sharply with the projected 30-year increase in the debt-to-GDP ratio, reaching 172%, over 2024 to 2054, according to the latest current Congressional Budget Office projections (see CBO 2024).
In this Economic Letter, we examine the outlook for the U.S. federal debt, starting with an overview of the factors that drive movements in the debt-to-GDP ratio. Given that the current debt-to-GDP ratio is close to its level at the end of WWII, past experiences could provide useful insights for the current long-run fiscal outlook. We find that the decline in the debt ratio after WWII resulted from a combination of eliminating the primary deficit and rapid economic growth.
Based on CBO projections of a persistent long-run primary deficit and a low rate of GDP growth compared with interest rates, we find that the outlook points to a steady increase in the debt ratio. Avoiding this outcome is likely to require some combination of major policy reforms—such as tax increases or slower growth in spending for programs like Medicare and Social Security—along with significantly higher economic growth and steady or falling interest rates.
What drives the debt-to-GDP ratio?
When assessing the amount of a government’s debt held by the public, it is particularly useful to measure it relative to GDP. GDP serves as a rough proxy for the economy’s tax base—that is, its capacity to pay back the debt. A high debt-to-GDP ratio increases government borrowing costs and can push up interest rates, which can reduce economic growth by increasing the cost of private investment.
The yearly change in the debt-to-GDP ratio is the sum of two components (Blanchard 2019). The first is that year’s primary deficit—which is government spending, excluding interest payments, minus revenue—as a share of GDP. The second component is the initial level of the debt-to-GDP ratio multiplied by the difference between the interest rate paid on debt and the rate of GDP growth. When the interest rate is higher than the rate of economic growth, it means interest payments—which is the interest rate multiplied by the level of debt—will push up the debt faster than economic growth pushes up GDP.
The debt-to-GDP ratio: Lessons from World War II
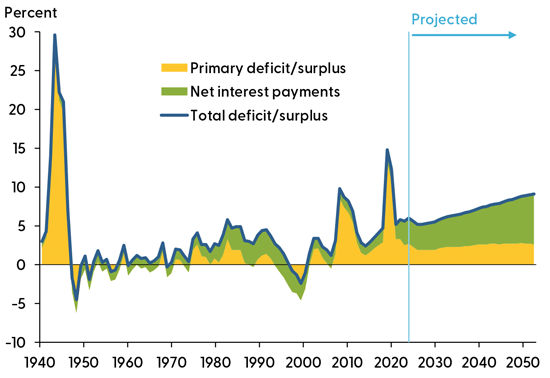
There are two strong parallels between the current era and the WWII era when it comes to the federal debt. The first parallel is the sharp run-up in the primary deficit. Figure 1 shows that the primary deficit skyrocketed between 1941 and 1945, driven mainly by defense spending, reaching a peak of nearly 30% of GDP in fiscal year 1943. The primary deficit also increased sharply during the pandemic, reaching around 12% of GDP in both 2020 and 2021. Moreover, it already had increased substantially during and right after the Great Recession. Indeed, the cumulative increase in the primary deficit as a share of GDP from 2008 to 2021 was almost three-fourths the size of the cumulative increase from 1940 to 1946.
Figure 1
Federal deficit as a percentage of U.S. GDP
The second parallel, which is largely a result of the first, is the very high debt-to-GDP ratio now and at the end of WWII (Figure 2). The current debt-to-GDP ratio, as of fiscal year 2023, was just below 100% of GDP, very close to where it was at the end of WWII.
Figure 2
Federal debt held by the public as a percentage of GDP
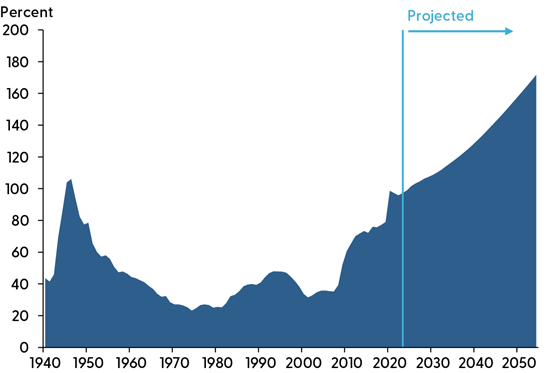
After peaking at over 100% in 1945 and 1946, the debt-to-GDP ratio gradually fell over the next three decades to only around 25% by 1975. What drove this decline after WWII? Recall that two components determine how the debt-to-GDP ratio moves over time. The first—the primary deficit—was quickly replaced by a primary surplus in the late 1940s and then settled close to zero for the next two decades.
With a near-zero primary deficit, the direction of the debt-to-GDP ratio is determined by the second component, which is the debt-to-GDP ratio times the difference between the interest rate paid on debt and the rate of economic growth. This component was generally negative between 1945 and 1975, pushing down the debt-to-GDP ratio. Specifically, according to data from Jordà et al. (2019), the average real (inflation-adjusted) rate of return on U.S. “safe assets”—defined by a hypothetical portfolio of Treasury bills and bonds with an approximate average maturity of 10 years—over this period was 2.3%. That same 30-year period saw real GDP growth average 3.0% per year.
In sum, the United States was able to reduce its post-WWII debt ratio from a historic high of over 100% in 1946 to a historic low of roughly 25% in 1975 by a combination of a balanced primary budget and economic growth that surpassed the interest rate on debt.
The current long-run fiscal outlook
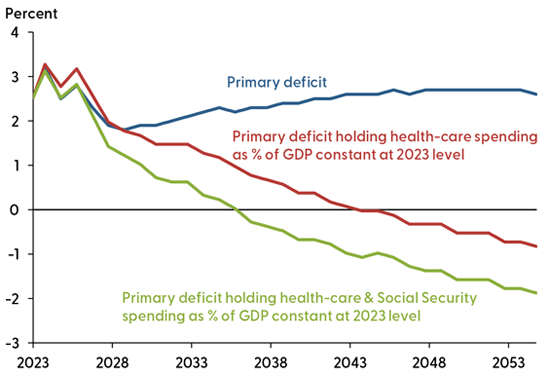
The outlook for the debt-to-GDP ratio over the next few decades will depend on these same two factors. Figure 3 shows the CBO’s projections of the primary deficit (blue line) over the next 30 years. In the near term, the primary deficit is projected to shrink modestly due to the projection’s assumptions that the post-pandemic economic recovery will continue and that certain tax provisions from the 2017 Tax Cuts and Jobs Act will be allowed to expire as scheduled. However, over the long run, the primary deficit is projected to increase gradually until the early 2040s before plateauing around 2.7% of GDP.
Figure 3
Projections of U.S. primary deficit through 2053
The main source of the long-run upward pressure on the primary deficit is spending on mandatory programs such as Social Security and Medicare. Current legislated formulas used to determine spending per recipient for Social Security benefits and government health-care programs, especially Medicare, combined with the projected aging of the population, point to large increases in spending for these programs as a share of GDP. This pressure was absent after WWII because the overall U.S. population was younger and because Medicare was not enacted until 1965.
Figure 3 shows the importance of this pressure on the deficit. The red line shows a projection of the primary deficit in which government health-care spending is assumed to grow at the same rate as GDP from fiscal years 2024 to 2054. We construct this data series by simply subtracting from the deficit the CBO’s projected increases in health-care spending as a share of GDP beyond fiscal year 2023. Given population aging, holding government health-care spending fixed as a share of GDP would require much slower growth in spending per beneficiary than has been recorded in recent decades. The green line is similar but assumes government health-care and Social Security spending grow at the same pace as GDP. The projection shows that limiting spending on these programs to grow no faster than the economy would eventually lead to a primary surplus. However, even imposing this restriction on both health-care programs and Social Security would not eliminate the primary deficit until 2036. Imposing the restriction just on health-care programs would not eliminate it until 2044. These calculations highlight the daunting challenge for future fiscal policy. Balancing the primary budget, which was a key factor in the decline of the debt-to-GDP ratio after WWII, would be likely to require major reforms to spending programs or large increases in tax revenue.
What about the other key factor for the debt ratio outlook, the rate of economic growth compared with the rate of interest? The long-run rates of GDP growth and interest are the subject of active empirical research and careful consideration by policymakers. For instance, four times a year Federal Open Market Committee participants provide their forecast for each of these rates in the Summary of Economic Projections (SEP). In the December 2023 SEP (Board of Governors 2023), the median projection for the long-run real federal funds rate was 0.5%, calculated as the median long-run nominal rate projection of 2.5% minus the median long-run inflation projection of 2.0% for the personal consumption expenditures (PCE) price index. Even if we account for the typical term spread between short-maturity safe assets like federal funds and the average maturity of Treasury debt of around 10 years—which is about one percentage point according to Blanchard (2019)—the resulting interest rate would be around 1.5%, below the SEP’s median projection for long-run real GDP growth of 1.8%. These rates would represent positive developments for the debt outlook because the high rate of economic growth relative to interest rates would exert downward pressure on the debt-to-GDP ratio.
However, the CBO provides a less optimistic view, projecting long-run real GDP growth of 1.5% and a long-run real interest rate on debt of 2.0% (CBO 2023); the latter is based on a projected nominal interest rate of 4.0% and PCE inflation rate of 2.0%, where “long-run” is defined by projections for 2053. In this case, slow economic growth relative to interest rates would exert modest upward pressure on the debt ratio, primarily from higher interest payments. As shown by the green shading in Figure 1, the CBO projects interest costs to grow as a share of GDP over the next 30 years. Two assessments underlie the CBO projections. First, investors in U.S. debt, expecting persistently high levels of borrowing from the government, would require relatively high interest rates to compensate for potential risk. And, second, those high interest rates increase borrowing costs for businesses, which discourages investment. Lower investment, in turn, could lead to slower growth for productivity and GDP.
Conclusion
With current U.S. federal debt as a share of U.S. GDP nearing its historical peak from the end of World War II, understanding the drivers of the postwar economy may hold some valuable insights for the future path of the federal debt. Both the primary deficit and the interest rate on debt compared with the economic growth rate turned negative over the three decades after WWII, pushing down the debt ratio from over 100% to only about 25%.
However, our Letter finds that the prospects for these factors over the next three decades are less favorable. Without major reforms to mandatory spending programs such as Social Security and Medicare, or large tax increases, the primary deficit is expected to persist. This leaves the rate of economic growth relative to interest rates as the crucial factor determining the path of the debt-to-GDP ratio over the next few decades. Current projections of GDP growth are relatively low—lower than after WWII. However, new technological advances, such as artificial intelligence, could fuel a productivity-led boost to long-run economic growth. Events abroad could also increase the foreign demand for U.S. Treasury notes as a safe asset, helping to stave off projected increases in long-run U.S. interest rates.
References
Blanchard, Olivier. 2019. “Public Debt and Low Interest Rates.” American Economic Review 109(4), pp. 1,197–1,229.
Congressional Budget Office. 2023. The 2023 Long-Term Budget Outlook. CBO Publication 59014.
Congressional Budget Office. 2024. “2024 Long-Term Budget Projections.” Downloadable data from Budget and Economic Data, February 7 release.
Jordà, Òscar, Katharina Knoll, Dmitry Kuvshinov, Moritz Schularick, and Alan M Taylor. 2019. “The Rate of Return on Everything, 1870–2015.” Quarterly Journal of Economics 134(3), pp. 1,225–1,298.
Federal Reserve Board of Governors. 2023. “Summary of Economic Projections.” December 13.
Opinions expressed in FRBSF Economic Letter do not necessarily reflect the views of the management of the Federal Reserve Bank of San Francisco or of the Board of Governors of the Federal Reserve System. This publication is edited by Anita Todd and Karen Barnes. Permission to reprint portions of articles or whole articles must be obtained in writing. Please send editorial comments and requests for reprint permission to research.library@sf.frb.org