
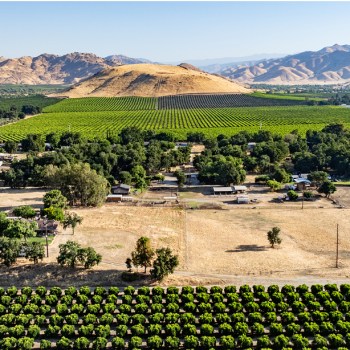
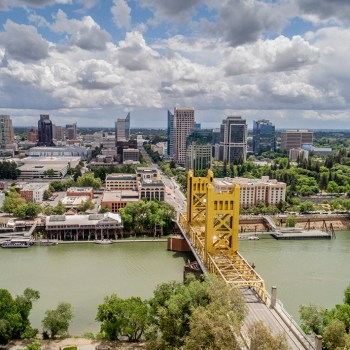
The Federal Reserve Bank of San Francisco serves the nine western states, two territories, and a commonwealth. This area is also known as the Federal Reserve’s Twelfth District.
The San Francisco Fed engages with businesses and communities across the region to gather real-time information on local economic conditions. These insights provide important context to quantitative data and analyses that the Federal Reserve uses to guide its monetary policy efforts. The San Francisco Fed also works to connect constituents with research, expertise, and networks that strengthen local economies. In this way, regional engagement furthers the Federal Reserve Bank of San Francisco’s mission of advancing the nation’s monetary, financial, and payment systems to build a stronger economy for Americans.
Engagement with Communities
The Community Engagement and Analysis team works to understand the economic experiences of lower-income households by engaging communities, conducting and sharing research on community development topics, and fostering connections among those working to expand economic opportunity in the Twelfth District.
Engagement with Regional Business Leaders
The Regional Business Engagement team fosters ongoing dialogue with local business and banking leaders across the region to deepen the Bank’s understanding of how different businesses are experiencing the economy in real-time. The San Francisco Fed conducts a variety of outreach and engagement activities to help build awareness and understanding of the Federal Reserve’s work.
Engagement with Local, State, and Federal Elected Officials
The Government and Civic Relations team acts as a resource to local, state, and federal elected officials and their offices. The San Francisco Fed engages with District leaders to share information about the Bank’s research, expertise, and mission to support the Federal Reserve’s dual mandate of maximum employment and stable prices.
Subscribe to the Bank’s mailing lists to learn more about what’s happening in the Twelfth District.
Featured Staff
Meet some of the experts leading the Bank’s Regional Engagement work.


Our District
Regional Community and Economic Perspectives
The Regional Community and Economic Perspectives network, comprised of community and business leaders from across the Twelfth District, provides the Federal Reserve Bank of San Francisco with real-time information on local economic conditions.
Explore Regional Engagement Work

Rocio Sanchez-Moyano, Natalie Holmes, Sarah Simms


Elizabeth Kneebone, Bina Patel Shrimali, DrPH

Natalie Holmes, Rocio Sanchez-Moyano, PhD, Sarah Simms
Natalie Holmes, Elizabeth Kneebone
Natalie Holmes, Elizabeth Kneebone
Natalie Holmes, Sarah Simms