Since 2009, U.S. job vacancies have increased but unemployment has fallen more slowly than in past recoveries. There is evidence that heightened uncertainty about economic policy has been an important factor behind this change. Increased uncertainty may discourage businesses from filling vacancies, thereby raising unemployment. An estimate indicates that, without policy uncertainty, the unemployment rate in late 2012 would have been close to 6.5%, 1.3 percentage points lower than the actual rate.
The U.S. labor market has recovered more slowly following the Great Recession than after previous recessions. Historically, the unemployment rate tends to fall as job openings increase, a relationship represented graphically by the Beveridge curve. However, even though the number of job openings in the economy has been rising during the recovery, the unemployment rate has remained stubbornly high. As a result, as Figure 1 shows, the Beveridge curve has shifted away from its historical pattern. There are now more jobless workers for a given number of job openings than in the decade before the downturn.
Figure 1
Actual and fitted Beveridge curve
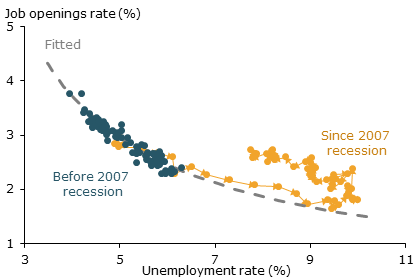
Sources: Job Openings and Labor Turnover Survey (JOLTS), Daly et al.
(2012), and authors’ calculations.
Researchers have suggested several reasons for this shift. Workers may not have the skills that match what is needed for current job openings. Alternatively, more generous unemployment benefits may have reduced the pressure on unemployed individuals to search for jobs. In this Economic Letter, we propose an alternative explanation. We present evidence that heightened uncertainty about economic policy during the recovery made businesses more reluctant to hire workers. When uncertainty rises, businesses become more hesitant to hire. They reduce recruiting efforts by raising hiring standards, increasing the number of interviews, or simply not filling vacancies. For instance, some businesses may interview candidates multiple times and end up deciding to postpone hiring altogether (see Rampell 2013).
Our results suggest that heightened policy uncertainty accounts for as much as two-thirds of the recent shift in the Beveridge curve. We estimate that uncertainty pushed the unemployment rate 1.3 percentage points higher by late 2012 than it would have been based on trends from the decade before the downturn. Without elevated uncertainty, unemployment would have been roughly 6.5% at the end of 2012, instead of the actual 7.8%.
Policy uncertainty should diminish as the economy improves and businesses regain confidence. As this happens, we expect the Beveridge curve to return to normal and the pace of the job market recovery to accelerate.
The Beveridge curve: Past and present
Figure 1 shows the Beveridge curve relationship between the unemployment rate and job vacancy rate from 2000 to 2012 (see Daly et al. 2012). The blue dots show that, before the Great Recession, the unemployment and job vacancy rates had a stable, inverse relationship. Unemployment typically fell as job openings rose. However, since late 2007, the Beveridge curve has gradually shifted outward, as shown by the yellow dots. Although job openings rose, unemployment fell more sluggishly than in the past, indicating slow recovery of the labor market.
What has caused this shift is a subject of debate. Some policymakers have suggested that the shift in the Beveridge curve may reflect a mismatch between the skills unemployed workers have and what employers are looking for (see Kocherlakota 2010). For example, an unemployed construction worker may have difficulty getting a job in information technology or health care, even though there may be openings in those sectors. Workers need time to learn new skills. Thus, an increase in skill mismatch could cause the unemployment rate to be persistently higher than before, creating a new normal. But recent research suggests that skill mismatch is probably not a main driving force behind a higher unemployment rate for a given level of vacancies and the resulting outward shift in the Beveridge curve (see Valletta and Kuang 2010, Barlevy 2011, and Daly et al. 2012).
Another possible explanation for the shift in the Beveridge curve is the expansion of unemployment insurance benefits, such as the 2008 extension of unemployment compensation. More generous benefits might encourage unemployed workers to slow their job searches, leading to more unemployment for a given number of vacancies. However, unemployment insurance benefits have been reduced substantially over the past two years, suggesting that the expansion of unemployment benefits is not a main factor behind the shift in the Beveridge curve.
Measuring shifts in the Beveridge curve
A rise in the level of uncertainty about fiscal and monetary policy is a third possible explanation for the shift in the Beveridge curve. To explore this, we need an economic model of the labor market. In such a model, the Beveridge curve is derived from a mathematical framework that determines the rate at which workers are hired given job vacancies and unemployment rates, and how efficiently workers are matched with available jobs. Thus, the hiring rate depends on the number of unemployed workers, the number of available job openings, and how much effort businesses put into filling vacancies, for example, by advertising. For a given number of job openings, if more people are unemployed and searching for jobs, then typically more hiring takes place because it is easier for businesses to find suitable candidates to fill vacancies. Similarly, for a given number of unemployed workers, an increase in job openings makes it easier to find jobs, also boosting the hiring rate.
In our model, we express the hiring rate in terms of the relationship between unemployment and job vacancies, the two variables that compose the Beveridge curve (see the Technical Appendix for details of the derivations). The efficiency of matching unemployed workers with jobs is a factor that can shift the Beveridge curve away from its normal path. Job matching efficiency is a broad concept that encompasses a range of variables, such as how intensively businesses recruit new employees. If the process of matching workers and jobs becomes less efficient, the Beveridge curve shifts to the right, meaning that, for a given job vacancy rate, the unemployment rate becomes higher.
Figure 2
Beveridge curve shifter and policy uncertainty
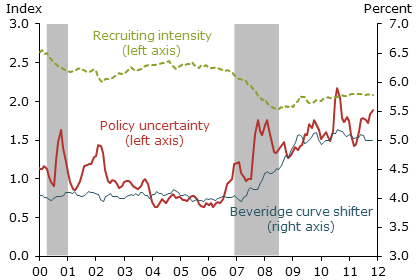
Note: Three-month moving average.
We use historical data on the unemployment rate and the vacancy rate to quantify changes in job match efficiency, generating a measure that we call the “Beveridge curve shifter.” In Figure 2, the blue line shows this measure. Since 2007, the Beveridge curve shifter has increased substantially, consistent with the outward shift in the Beveridge curve displayed in Figure 1.
Figure 2 also shows a measure of economic policy uncertainty developed by Baker, Bloom, and Davis (2013). It is constructed using the volume of newspaper articles discussing economic policy uncertainty, the number of tax code provisions scheduled to expire, and the extent of disagreements among economic forecasters about such variables as future levels of inflation and government spending. The large outward shift in the Beveridge curve occurred at the same time that this measure of policy uncertainty rose significantly. This raises the question of whether heightened policy uncertainty since 2007 may have contributed to the outward shift in the Beveridge curve.
Research by Davis, Faberman, and Haltiwanger (2013) suggests that the Beveridge curve shifter captures variations in recruiting intensity among businesses. Less intensive recruiting lowers the rate at which businesses fill job vacancies. This leads to a higher unemployment rate for a given number of job openings and thus shifts the Beveridge curve outward. The green dashed line in Figure 2 indicates that, consistent with the large increases in the Beveridge curve shifter, recruiting intensity as measured by Davis et al. has declined substantially during the recession and recovery.
Effects of policy uncertainty on shifts in the Beveridge curve
So far, we have demonstrated a correlation between heightened policy uncertainty and the outward shift in the Beveridge curve. The next step is to assess how much heightened policy uncertainty may have contributed to this shift. To answer this question, we use a statistical model to explore the relationships between changes in policy uncertainty and the other variables in our model, including the unemployment rate, the job vacancy rate, and our measure of the Beveridge curve shifter. We use our model to estimate the extent to which surprise changes in policy uncertainty produced movements in the Beveridge curve shifter. Once we know the extent to which policy uncertainty drove the Beveridge curve shifter, we can calculate the effects of uncertainty on the unemployment rate in our theoretical model, given the job vacancy rate.
Figure 3
Policy uncertainty and shifts in the Beveridge curve
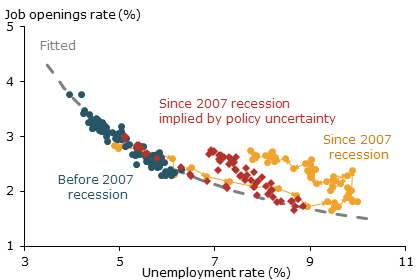
Sources: JOLTS, Daly et al. (2012), and authors’ calculations.
The red diamonds in Figure 3 represent that part of the Beveridge curve that has been driven by policy uncertainty, based on estimates we put into our statistical model. As the figure shows, policy uncertainty did not contribute to the shift in the Beveridge curve from December 2007 to August 2009. However, beginning in autumn 2009, policy uncertainty became an increasingly important factor behind the shift in the Beveridge curve. By the end of 2012, heightened policy uncertainty accounted for about two-thirds of the shift. Our results suggests that, in late 2012, if there had been no policy uncertainty shocks, the unemployment rate would have been close to 6.5% instead of the reported 7.8%.
Finally, we consider the mechanism by which heighted uncertainty may have contributed to the shift in the Beveridge curve. Specifically, we examine how much policy uncertainty reduced the job recruiting intensity of businesses. We use our model to perform a statistical exercise that explores the relationship of policy uncertainty, unemployment, vacancies, and a measure of recruiting intensity based on the methods described in Davis, Faberman, and Haltiwanger (2013). We find that, all else equal, a surprise increase in policy uncertainty leads to a statistically significant decline in recruiting intensity.
Conclusion
Statistical evidence suggests that heightened policy uncertainty has contributed significantly to the outward shift in the Beveridge curve during the current recovery. In an uncertain economic environment, businesses reduce their recruiting intensity. This means that job seekers are less likely to be successful in finding work, even though posted job vacancies increase. This change in the relationship between job vacancies and unemployment is associated with an outward shift in the Beveridge curve and a higher unemployment rate for a given rate of job vacancies. However, as the economy recovers and uncertainty recedes, our finding suggests that the Beveridge curve should return to its pre-recession position and the pace of job recovery should accelerate.
References
Baker, Scott R., Nicholas Bloom, and Steven J. Davis. 2013. “Measuring Economic Policy Uncertainty.” Unpublished manuscript, Stanford University.
Barlevy, Gadi. 2011. “Evaluating the Role of Labor Market Mismatch in Rising Unemployment.” FRB Chicago Economic Perspectives 35(Q3).
Daly, Mary C., Bart Hobijn, Aysegul Sahin, and Robert G. Valletta. 2012. “A Search and Matching Approach to
Labor Markets: Did the Natural Rate of Unemployment Rise?” Journal of Economic Perspectives 26(3), pp. 3–26.
Davis, Steven J., R. Jason Faberman, and John C. Haltiwanger. 2013. “The Establishment-Level Behavior of
Vacancies and Hiring.” Quarterly Journal of Economics (forthcoming).
Kocherlakota, Narayana. 2010. “Inside the FOMC.” Speech delivered August 17 in Marquette, MI.
Rampell, Catherine. 2013. “With Positions to Fill, Employers Wait for Perfection.” New York Times, March 6.
Valletta, Robert, and Katherine Kuang. 2010. “Is Structural Unemployment on the Rise?” FRBSF Economic Letter 2010-34 (November 8).
Opinions expressed in FRBSF Economic Letter do not necessarily reflect the views of the management of the Federal Reserve Bank of San Francisco or of the Board of Governors of the Federal Reserve System. This publication is edited by Anita Todd and Karen Barnes. Permission to reprint portions of articles or whole articles must be obtained in writing. Please send editorial comments and requests for reprint permission to research.library@sf.frb.org