In response to the global financial crisis, the Federal Reserve relied more heavily on communication to shape expectations. Since 2012 the Fed has released the Summary of Economic Projections reflecting the range of expectations from FOMC meeting participants. Policymakers also deliver speeches to further clarify their views. Using textual analysis to quantify the content of those speeches reveals a somewhat diverse set of views among policymakers. Regardless of the broad range of views, there is a positive relationship between the content of the centermost speech and the median projection for the policy rate.
As a response to the global financial crisis and the ensuing recession of late 2007 through mid-2009, the Federal Reserve lowered its policy rate to near zero in December 2008, where it remained until December 2015. During that period, the Fed made wide use of unconventional monetary policies, particularly relying on communication to promote transparency (FRBSF 2012), shape expectations about future interest rate policy, and provide additional stimulus to the economy (Carvalho, Hsu, and Nechio 2016a,b).
Although the Fed has regularly released statements and minutes of its policy meetings since 1999, the use of communication as a policy tool intensified during the period when its policy rate was constrained by the zero lower bound. In particular, since 2012, following every other Federal Open Market Committee (FOMC) meeting, the Fed has released the Summary of Economic Projections (SEP), which contains economic projections from meeting participants. In addition, FOMC meeting participants give frequent speeches to the public, which provide information about Fed officials’ views on the economy.
In this Economic Letter, we assess how the SEP’s medium-term interest rate projections compare with the views of FOMC participants as revealed in their speeches. To measure the latter we use the Prattle Fed Index, which quantifies the content of every Fed communication based on textual analysis. We find that both types of communication, the SEP and speeches, reveal a somewhat wide range of views. Nevertheless, the content of the centermost speech correlates fairly strongly with the median SEP projection.
Summary of Economic Projections
The FOMC holds eight regularly scheduled meetings during the year and other unscheduled meetings as needed, releasing policy statements and minutes following every meeting.
Since 2012, the FOMC has also released the SEP four times a year after every other meeting. These projections are submitted by all meeting participants—the regional Federal Reserve Bank presidents and the governors of the Federal Reserve Board—forming a group of about 17 individuals.
In their projections, participants give their views on the most likely outcomes for real output growth, the unemployment rate, inflation, and the federal funds rate over the short, medium, and long term based on their assessment of economic conditions and appropriate monetary policy (for example, see Federal Reserve Board 2013a and 2014a). The SEP discloses all projections, although it does not reveal which projection belongs to which participant.
As an example, Figure 1 shows the medium-term projections for the policy rate two to three years ahead released between September 2013 and June 2014 (Federal Reserve Board 2013a,b and 2014a,b). More specifically, each dot in the figure corresponds to a projection submitted by an FOMC participant for the federal funds rate in 2016.
Figure 1
SEP projections for the federal funds target rate in 2016
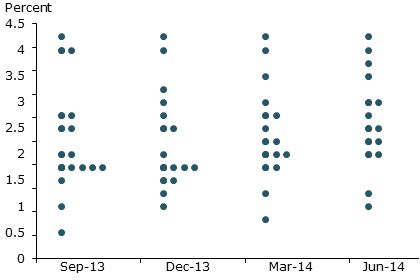
Source: Federal Reserve Board of Governors.
The figure shows that in those publications, the so-called dot-plot projections ranged from 0.5% to 4.25%, with a median projection of 2.25%. Figure 1 reveals that the dispersion of projections from high to low covers a fairly wide range of up to 3.75 percentage points. By comparison, over the full period of available SEP projections from June 2012 to June 2016, the average difference between the highest and the lowest medium-term interest rate projections has been nearly as large at about 2.9 percentage points.
Quantifying communication
In addition to the written publications released by the Federal Reserve Board, Fed officials frequently give speeches to the public to clarify their views about the current state and the future of the economy. Markets often focus on this sort of communication because they can give important insights into the possible outcomes of upcoming meetings (for example, see Barton and Hall 2016 and Wall Street Journal 2016).
As Fed communication intensified since the crisis, researchers and market participants have explored methods to quantify the content of Fed communication releases (see, for example, Carvalho et al. 2016a,b, Swanson 2015, and Prattle Analytics). In particular, Prattle Analytics LLC, or Prattle for short, generates a sentiment score for every communication by the Fed or its officials to quantify the content or sentiment based on textual analysis. Specifically, the Prattle machine-learning algorithm considers the words and phrases in a given Fed communication to generate a score. The algorithm has been “trained” by observing what words and phrases tend to be associated with asset price movements in the past. A positive score reveals a hawkish sentiment, indicative of a tighter monetary policy stance, while a negative score indicates a more dovish sentiment, indicative of a looser monetary policy stance. A score near zero suggests a neutral stance.
Figure 2 reports Prattle scores for FOMC meeting participants’ speeches given in the days leading up to the FOMC meetings in September and December 2013 and March and June 2014. Because FOMC participants are prohibited from giving speeches in the week immediately before the start of meeting, Figure 2 effectively reports Prattle scores for speeches given during the 15 days preceding each “blackout” week. Each dot in Figure 2 corresponds to a score associated with a speech from an FOMC participant.
Figure 2
Prattle scores for speeches delivered before FOMC blackouts
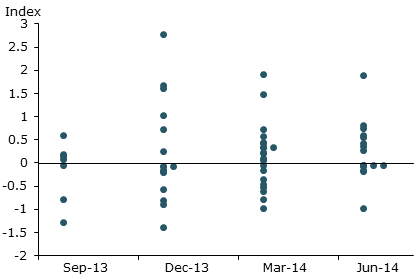
Source: Prattle Analytics LLC residual scores.
Figure 2 shows that just before the December 2013 meeting, for example, the Prattle scores for speeches ranged from –1.4 to 2.77, while before the June 2014 meeting, the scores ranged from –0.98 to 1.89. For all meetings depicted, scores were relatively evenly split between being hawkish and dovish.
Words and numbers
The dispersion in SEP projections, as illustrated in Figure 1, is frequently noted by market participants, who interpret the wide range of projections as being suggestive of conflicting views among FOMC participants (Crump et al. 2014 and Derby 2016).
Figure 2 reveals a similar wide range of sentiment scores for speeches, reinforcing the interpretation of a significant dispersion of views among FOMC participants. In the past four years, about 11 speeches on average are delivered preceding each blackout week. The average difference between the highest and the lowest Prattle sentiment score for speeches is 2.1 points.
It’s important to note that speeches can refer to many different aspects of the economy and reflect views about different horizons. Therefore, this method differs substantially from the SEP, which has a well-defined variable and time horizon to project. One should be careful in comparing the dispersion in the content of speeches with the SEP forecast dispersion. Yet, despite these differences, Fed officials’ speeches are usually meant to clarify their views on the economy which are, ultimately, related to their vote in the FOMC meeting and their projections for the years ahead. Hence, the different tones or sentiments in those speeches should, at the very least, shed some light on the paths officials project for the future of the U.S. economy.
Because we cannot identify who submitted which projection, we cannot directly compare participants’ SEP projections with their speeches. Instead, we focus on comparing the medians of the distributions of these two data sets, that is, the centermost SEP projection and speech sentiment scores. In fact, Fed officials frequently refer to the median SEP projection in their communications to the public as a more informative metric about the future path of the policy rate (see, for example, Yellen 2014 and Williams 2016). While the overall projections may be diverse at times, the median can help indicate how the meeting participants ultimately converge in their voting.
Figure 3 depicts the relationship between these two measures, with median SEP interest rate projections for the medium-term interest rate on the vertical axis and median Prattle scores for speeches delivered before the corresponding blackout week on the horizontal axis. The figure includes median data for all FOMC meetings with an SEP release between June 2012 and June 2016. The figure also includes a regression line that depicts the statistical relationship between the two data series.
Figure 3
Median Prattle scores and medium-term interest rate projections
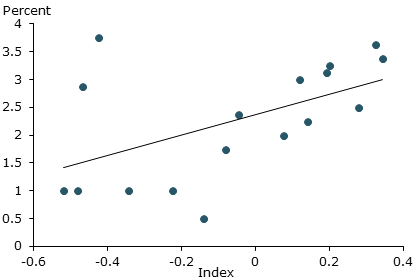
Source: Prattle Analytics LLC, Federal Reserve Board of Governors, and authors’ calculations.
The figure shows a statistically reliable positive relationship between the median sentiment scores and the median medium-term SEP interest rate projections. This positive relationship suggests that, on average, speeches preceding the meeting that carry a more hawkish sentiment are associated with a higher projected level for the policy rate in the medium term.
This positive relationship also holds when we consider alternative sets of SEP projections and speeches, although these are not shown in the figure. In particular, we find a similar positive relationship between Prattle scores and SEP projections for the interest rate in the short term, that is, over the next year. We also compared the median medium-term interest rate projections with the median Prattle scores for speeches delivered over a longer period of up to one month before each blackout week; we find that the relationship is positive but not as statistically reliable.
Conclusion
Fed communication has increased in importance and intensity during the eight years when the policy rate was kept near zero. One fairly new communication, the Survey of Economic Projections, discloses FOMC participants’ anonymous views on the future path of the policy rate, as well as their views about other economic variables four times a year. Those participants also directly address the public, making speeches to reveal and clarify their views. While both types of communication reveal sizable dispersion of views, the centermost point for speeches according to Prattle scores measuring their content positively correlates with median projections for the policy rate in the medium term from the SEP.
Fernanda Nechio is a senior economist in the Economic Research Department of the Federal Reserve Bank of San Francisco.
Rebecca Regan is a research associate in the Economic Research Department of the Federal Reserve Bank of San Francisco.
References
Barton, Susanne, and Taylor Hall. 2016. “Treasury Two-Year Notes Fall as Fed Officials Hint at Rate Hikes.” Bloomberg. May 17.
Carvalho, Carlos, Eric Hsu, and Fernanda Nechio. 2016a. “Fed Communication and the Zero Lower Bound.” FRBSF Economic Letter 2016-21 (July 11).
Carvalho, Carlos, Eric Hsu, and Fernanda Nechio. 2016b. “Measuring the Effect of the Zero Lower Bound on Monetary Policy.” FRB San Francisco Working Paper 2016-06.
Crump, Richard, Troy Davig, Stefano Eusepi, and Emanuel Moench. 2014. “Connecting ‘the Dots’: Disagreement in the Federal Open Market Committee.” Liberty Street Economics blog, September 25, FRB New York.
Derby, Michael. 2016. “Fed Officials Spar Over Value of ‘Dot Plot’ Rate Forecasts” Wall Street Journal, June 14.
Federal Reserve Bank of San Francisco. 2012. “You Have Written about Fed Transparency Before, but I Wonder if the Federal Reserve Has Learned Any New Lessons in the Aftermath of the Financial Crisis?” Dr. Econ, August.
Federal Reserve Board of Governors. 2013a. “Summary of Economic Projections.” September 18.
Federal Reserve Board of Governors. 2013b. “Summary of Economic Projections.” December 18.
Federal Reserve Board of Governors. 2014a. “Summary of Economic Projections.” March 19.
Federal Reserve Board of Governors. 2014b. “Summary of Economic Projections.” June 18.
Prattle Analytics, LLC. “Central Bank Sentiment Index.”
Swanson, Eric T. 2015. “Measuring the Effects of Unconventional Monetary Policy on Asset Prices.” NBER Working Paper 21816.
Wall Street Journal. 2016. “Markets React to Janet Yellen–Recap.” March 29.
Williams, John C. 2016. “After the First Hike.” Presentation to California Bankers Association, Santa Barbara, California, January 8.
Yellen, Janet. 2014. “FOMC: Press Conference.” Federal Reserve Board of Governors, March 19.
Opinions expressed in FRBSF Economic Letter do not necessarily reflect the views of the management of the Federal Reserve Bank of San Francisco or of the Board of Governors of the Federal Reserve System. This publication is edited by Anita Todd and Karen Barnes. Permission to reprint portions of articles or whole articles must be obtained in writing. Please send editorial comments and requests for reprint permission to research.library@sf.frb.org