Separating U.S. economic output into permanent and transitory components can help explain the effects of recessions and expansions. GDP growth shifted to a lower trend rate in 2000, indicating a slowdown long before the 2008–09 recession. GDP was substantially above trend before that recession; it then declined significantly and did not recover to its trend rate until 2017. The recession resulted in permanent losses to GDP. Without those permanent effects, GDP at the end of the latest expansion would have been about $380 billion or $1,460 per person higher.
The United States experienced its longest expansion on record between the end of the 2008–09 recession that coincided with the Global Financial Crisis (GFC) and the onset of the COVID-19 pandemic. Yet the gap between actual GDP and the level predicted by its trend was quite slow to close. Such sluggish recoveries are common following financial crises (Fernald et al. 2018; Reinhart and Rogoff 2009). Financial crises often lead to long-term—sometimes permanent—losses relative to what GDP would have been without the crisis. For example, Cerra and Saxena (2006) estimate that GDP losses last 10 years on average beyond the end of financial crises.
In this Economic Letter, we assess the permanent and transitory effects of the GFC and the ensuing recession on output (GDP) in the United States. Transitory effects underlie the typical pattern where economic activity falls during recessions and rises during expansions. These effects can include temporary job losses and lower consumer and business demand due to weak financial positions. Permanent effects are those that persist beyond the end of recessions and expansions. These can stem from reduced research and development or business formation—factors that fuel future productivity gains—and from people dropping out of the labor force. Put differently, changes in GDP consist of permanent effects associated with changes in its trend and transitory effects associated with the business cycle fluctuations around the trend.
We identify several important features of GDP growth before, during, and after the 2008–09 recession. First, we estimate that trend GDP was essentially split into a high-growth period before 2000 and a low-growth period after 2000. This slowdown occurred long before the GFC, with no evidence of further slowing in trend growth afterward. This implies the slowdown in growth was unrelated to that recession. Second, we estimate that GDP was substantially above trend in the years before the GFC and, after a precipitous decline, only returned to trend in 2017. Third, we find large permanent effects of the 2008–09 recession from declines in the trend that reduced GDP in the fourth quarter of 2019 by about $380 billion, or about $1,460 per person, measured in 2012 dollars. In other words, GDP was nearly 2% below what it would have been had the GFC never occurred.
Dividing GDP into a trend and a cycle
We use a statistical method known as a trend-cycle decomposition (see Morley et al. 2003) on quarterly inflation-adjusted, or real, GDP, seasonally adjusted at an annual rate, from 1985 to 2019. The start of this period coincides with the beginning of the so-called Great Moderation, when macroeconomic volatility decreased substantially from more turbulent earlier decades. The sample ends in the last quarter of 2019, before the COVID-19 pandemic hit the U.S. economy starting in early 2020. Because the period includes the entire expansion that followed the GFC, we are better able to estimate which parts of the expansion were due to permanent shifts versus typical business cycle dynamics.
Our trend-cycle decomposition separates real GDP into a trend component that captures permanent shifts in real GDP and a cycle component that captures transitory deviations from the trend of real GDP. Trend GDP tends to be relatively stable and has two sources of variation. The first is shifts in its average growth, which capture slowdowns in the growth of GDP over longer periods. The second is changes that affect the level of the trend without altering the longer-term growth rate. The cycle component is characterized by continual variation around the trend level of GDP.
Figure 1 shows the level of real GDP (blue line) and our estimate of its trend (green line). GDP fluctuates above and below the trend level, with slowdowns in growth or outright declines around recessions (gray bars) and faster-than-trend growth during expansions. After testing models using zero, one, and two shifts in the trend average growth rate, we find the model of GDP that best fits the data includes only one shift, in the second quarter of 2000. The slowdown in average trend growth from 3.3% to 2.0% at a seasonally adjusted annualized rate represents a permanently lower trend after 2000 than if the pre-2000 growth trajectory had continued. The fact that this break occurred nearly 10 years before the GFC suggests that the crisis did not contribute to this slowdown in trend growth.
Figure 1
Real GDP and estimated trend, 1985–2019
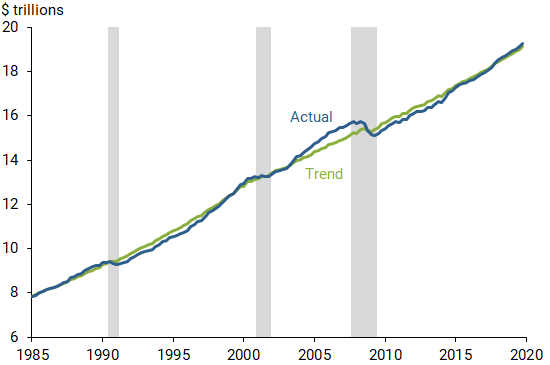
Note: Measured in 2012 dollars. Gray bars indicate NBER recession dates.
Several longer-run forces drive trend GDP growth, including labor force growth, productivity growth, and investment. Our estimate of a slowdown in 2000 predates a break due to a shift in productivity growth in 2004 studied by Fernald and Li (2019) and Foerster et al. (2020). Finding a slowdown in 2000 suggests that factors beyond reduced productivity growth contributed to the slowdown in trend GDP growth.
Deviations of GDP from trend in Figure 1 represent the cyclical component of our decomposition. Figure 2 shows this cyclical component as percent deviations from trend. The recession and expansion dynamics are readily apparent, as the cycle declined around all three recessions and grew over expansions. An expansion in the 1980s gave way to the 1990–91 recession, when the cycle component of GDP fell about 4 percentage points. The expansion started relatively slowly, then gathered steam in the latter half of the 1990s. The 2001 recession was relatively mild, with the cyclical component declining only about 1 percentage point.
Figure 2
Estimated cyclical component of GDP
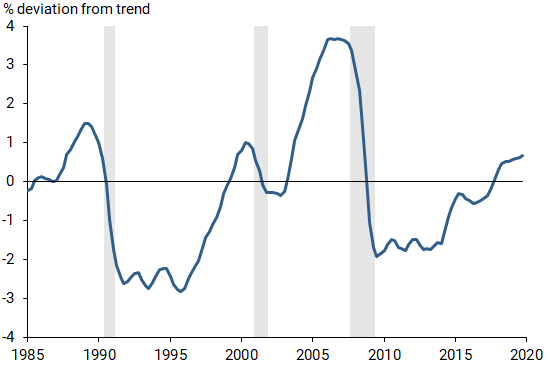
Note: Gray bars indicate NBER recession dates.
In the pre-crisis expansion of 2001–08, GDP reached an unprecedented high relative to its trend. GDP was only slightly below trend as the expansion started, and continued growth pushed GDP nearly 4% above trend. The GFC and 2008–09 recession caused a very large drop in GDP of 6 percentage points relative to trend. The sluggish recovery in the 2010s kept GDP below trend for several years.
The dynamics of the GDP cycle imply two notable features about the expansion from 2009–19. First, simply extrapolating from the above-trend 2001–08 GDP data would incorrectly imply a higher trend level than our decomposition indicates. Mistakenly attributing the cyclical GDP surge to a change in trend distorts the inference about the post-GFC expansion. This could lead to incorrect conclusions about the economy’s productive capacity and hence the degree of economic slack relative to that capacity—that is, how hot or cold the economy is. Second, even with our estimate of trend that avoids mischaracterizing the surge, GDP didn’t return to trend after the GFC until 2017. This sluggish expansion was driven by average growth alone through 2014, while the cyclical component necessary to recover from recessions remained flat. After 2014, only slightly stronger growth returned the cyclical component to trend over the next several years. The dynamics of the recent expansion resemble the 1990s expansion, when the cyclical component remained flat for several years after the recession ended; however, stronger growth relative to trend in the second half of the 1990s expansion pushed GDP to recover to trend faster.
Our results highlight that the transitory effects of the 2008–09 recession included a major reversal in above-trend GDP from the previous recession, and then a long and slow expansion that didn’t return to trend until 2017. Our statistical analysis does not identify the economic factors driving these cyclical dynamics, but the high above-trend GDP in the mid-2000s coincided with the housing boom, while the massive decline was consistent with a financial crisis slowdown. The slow recovery can be attributed to the need to rebuild net worth after the crisis and a labor market that took exceptionally long to heal after the shock (Fernald et al. 2018).
The permanent effects of the recession
Above we discuss the permanent effects on GDP of a change in trend growth from 3.3% to 2.0% in 2000, and how this contributed to the slower expansion after the 2008–09 recession. By examining changes to the trend level during the 2008–09 recession, we can examine how the recession itself permanently reduced GDP. A decline in the trend during the recession lowers the trend in all subsequent quarters. This implies that, if the trend declined substantially in a recession, then GDP in all future quarters will be permanently lower. The declines in the trend could be caused by factors such as lost opportunities to increase productivity through research and development or new business formation, or individuals dropping out of the labor force.
While our measure in Figure 1 shows a meaningful decline in trend GDP during the 2008–09 recession, the decline in actual GDP was much larger. To better visualize these declines, Figure 3 focuses on the dynamics of actual GDP from 2008 through 2019. We also estimate what GDP would have been without the permanent trend declines generated during the recession (green line). Actual GDP (blue line) declined during the recession due to declines in both the trend and the cyclical component. The trend continued to rise during the expansion, and the cyclical component slowly recovered such that actual GDP ended 2019 slightly above trend.
Figure 3
Permanent effects of the 2008–09 recession on GDP
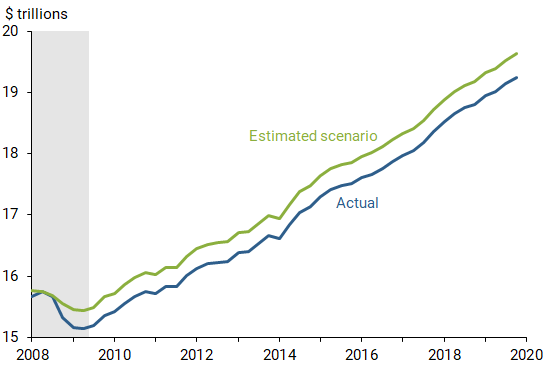
Note: Measured in 2012 dollars. Gray bar indicates NBER recession dates.
Our estimated series in Figure 3 assumes that trend GDP didn’t decline during the recession but its subsequent pattern and the cycle are unchanged. In other words, this series answers the question, “What if the 2008–09 recession did not have permanent negative effects?” The result suggests the declines in GDP would have been less substantial during the recession, hence growth during the expansion would have started from a higher level.
The gap between our series and actual GDP shown in Figure 3 quantifies the permanent effects of the recession. By the end of the expansion in the fourth quarter of 2019, the permanent effects of the recession had lowered GDP by about $380 billion. This value equals nearly 2% of GDP. That would imply a loss of output of about $1,460 for each U.S. adult. Of course, this average value does not account for important distributional considerations, such as the unequal gains in labor markets during the recovery (Daly 2020).
Conclusion
Using a statistical model that divides GDP into trend and cyclical components, we find the 2008-09 recession had substantial transitory and permanent effects. While slower trend growth predated the recession by almost 10 years, the recession is associated with a massive rapid reversal of an above-trend economy and was followed by a tepid expansion. GDP did not return to its trend level until 2017. Furthermore, the recession lowered the trend level of GDP, indicating permanent effects. These permanent effects lowered GDP in the fourth quarter of 2019 by about $380 billion, or $1,460 per person.
Andrew Foerster is a research advisor in the Economic Research Department of the Federal Reserve Bank of San Francisco.
Lily M. Seitelman is a research associate in the Economic Research Department of the Federal Reserve Bank of San Francisco.
References
Cerra, Valerie, and Sweta Chaman Saxena. 2008. “Growth Dynamics: The Myth of Economic Recovery.” American Economic Review 98(1), pp. 439–457.
Daly, Mary C. 2020. “Is the Federal Reserve Contributing to Economic Inequality?” FRBSF Economic Letter 2020-32 (October 19).
Fernald, John, Robert E. Hall, James H. Stock, and Mark W. Watson. 2018. “The Disappointing Recovery in U.S. Output after 2009.” FRBSF Economic Letter 2018-04 (February 12).
Fernald, John, and Huiyu Li. 2019. “Is Slow Still the New Normal for GDP Growth?” FRBSF Economic Letter 2019-17 (June 24).
Foerster, Andrew, Christian Matthes, and Lily M. Seitelman. 2020. “The Highs and Lows of Productivity Growth.” FRBSF Economic Letter 2020-21 (August 3).
Morley, James, Charles Nelson, and Eric Zivot. 2003. “Why are the Beveridge-Nelson and Unobserved-Components Decompositions of GDP So Different?” The Review of Economics and Statistics 85(2), pp 235-243.
Reinhart, Carmen, and Kenneth Rogoff. 2009. This Time Is Different: Eight Centuries of Financial Folly. Princeton, NJ: Princeton University Press.
Opinions expressed in FRBSF Economic Letter do not necessarily reflect the views of the management of the Federal Reserve Bank of San Francisco or of the Board of Governors of the Federal Reserve System. This publication is edited by Anita Todd and Karen Barnes. Permission to reprint portions of articles or whole articles must be obtained in writing. Please send editorial comments and requests for reprint permission to research.library@sf.frb.org