
In times of economic crisis, it is critically important for policymakers to have up-to-date information on economic conditions. However, so-called hard data on payroll employment, personal income, consumer spending, and business investment are published with lags of weeks or months. Thus, analysts also follow “soft” data, such as consumer and business sentiment, which are released more quickly and are generally predictive of the hard data. But most survey-based sentiment indexes are less frequent, which limits their usefulness in times of sudden change, or have a short history, which prevents comparisons with past episodes.
By contrast, our newly developed Daily News Sentiment Index provides real-time data collected from newspaper reports from 1980 to today, offering insights from past conditions. Weekly updates also make the index particularly valuable when economic conditions change rapidly, as they have during the coronavirus disease 2019 (COVID-19) outbreak.
Tracking Sentiment through News Reports
To create the index, we construct sentiment scores for economics-related news articles from a historical archive of 16 major U.S. newspapers. We aggregate data from individual article scores into a smoothed daily time-series measure of news sentiment, adjusting for changes in the sample across newspapers over time. Our method and findings are detailed in Shapiro, Sudhof, and Wilson (2020) and Buckman et al. (2020). Weekly updates are posted on the San Francisco Fed’s data page for the Daily News Sentiment Index.
Our index is highly correlated historically with the monthly survey-based University of Michigan Index of Consumer Sentiment and the Conference Board’s Consumer Confidence Index. This suggests that news sentiment is picking up similar information to these traditional measures of how consumers feel about the economy.
Sentiment during COVID-19 versus the Financial Crisis
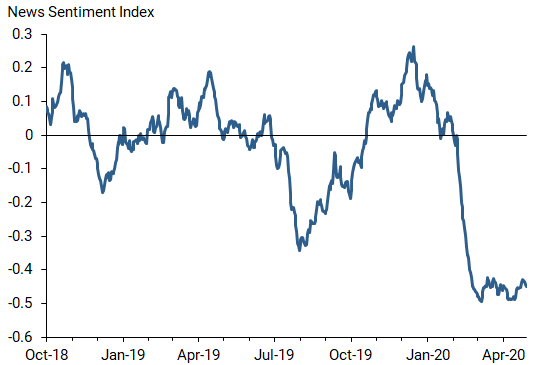
Figure 1 shows that the sentiment index plunged beginning in January 2020, when U.S. news began to cover the possible implications for the U.S. economy of the coronavirus outbreak occurring in China at that time. The sentiment collapse accelerated in early March with increasing news coverage about the COVID-19 pandemic. This included unprecedented social distancing measures enacted by various local governments across the United States. By early April, the index began to flatten out, and it has remained around this low level since then.
Figure 1
Daily news sentiment in the time of COVID-19
How does this pattern compare with what happened to news sentiment in the last major economic crisis, the 2008 global financial crisis? Figure 2 plots the Daily News Sentiment Index over the course of the two economic crises. The green line shows the sentiment index during the financial crisis, while the blue line shows the sentiment index during the current crisis. We date the start of each crisis based on the preceding stock market peak using the Wilshire 5000 index. For the earlier crisis, the stock market peaked on August 28, 2008, about two weeks before Lehman Brothers declared bankruptcy. Before the current crisis due to the COVID-19 pandemic, the stock market peaked on February 19, 2020.
Figure 2
Comparing news sentiment in the current and 2008 crises
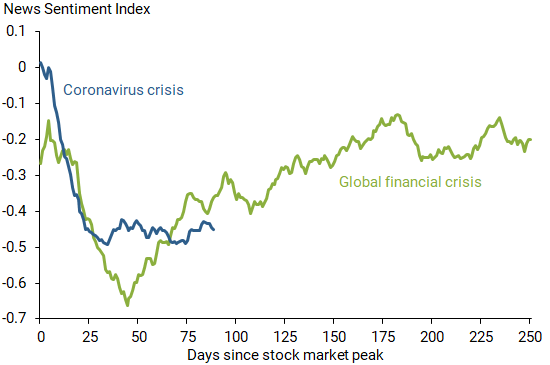
News sentiment dropped very rapidly during both crises, reaching a bottom in approximately 50 days. The size of the declines are also similar, although news sentiment during the financial crisis started out lower and therefore bottomed out at a lower level. Thus, the news sentiment index declined at a similar pace and scale during both crises.
However, Figure 3 shows that the subsequent recoveries show starkly different patterns so far. In the earlier crisis, the Wilshire 5000 did not hit bottom until March 9, 2009, 193 days from the peak (red line). Despite this long-lasting deterioration in financial markets, news sentiment recovered nearly as fast as it fell. In the current crisis, the Wilshire 5000 hit bottom on March 23, 2020, 33 days from the peak (blue line). Despite a quick and strong rebound in stock market conditions, news sentiment has remained near its trough as of the latest update.
Figure 3
Comparing market recoveries in the current and 2008 crises
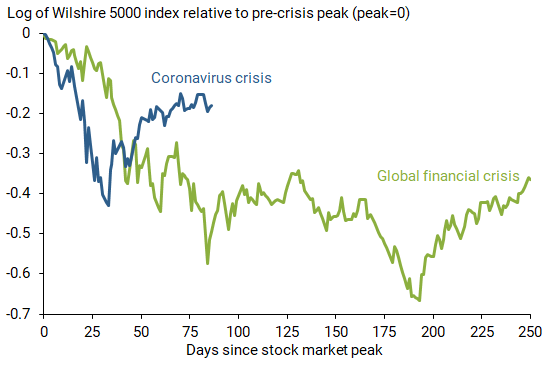
In sum, during the global financial crisis, news sentiment showed a V-shaped pattern despite a U-shaped stock market pattern. This suggests a decoupling of the sentiment in the economic news from that of stock market participants, with the former rebounding as the latter remained pessimistic. In the current episode, though, news sentiment appears to be in the first half of a U pattern, despite a V-shaped stock market pattern. This suggests that renewed optimism in the financial markets is not translating into a more positive tone in the economic news media.
The different patterns in news sentiment could reflect a multitude of factors. However, from this comparison it appears that in crises the stock market and news sentiment can move very different ways.
Shelby R. Buckman is a research associate in Economic Research at the Federal Reserve Bank of San Francisco.
Adam Hale Shapiro is a research advisor in Economic Research at the Federal Reserve Bank of San Francisco.
Daniel J. Wilson is a vice president in Economic Research at the Federal Reserve Bank of San Francisco.
Image credit: DONOT6 via iStock.
References
Buckman, Shelby R., Adam Hale Shapiro, Moritz Sudhof, and Daniel J. Wilson. 2020. “News Sentiment in the Time of COVID-19.” FRBSF Economic Letter 2020-08 (April 6).
Shapiro, Adam Hale, Moritz Sudhof, and Daniel J. Wilson. 2020. “Measuring News Sentiment.” FRB San Francisco Working Paper 2017-01.
The views expressed here do not necessarily reflect the views of the management of the Federal Reserve Bank of San Francisco or of the Board of Governors of the Federal Reserve System.