

U.S. net international migration (NIM) dropped significantly in recent months after starting to decline last year from its historically high annual levels. An update of earlier San Francisco Fed analysis (Duzhak 2024) using new data suggests that the number of immigrants entering the United States began to decline in the second half of 2024 and fell sharply in the first half of 2025.
NIM levels for 2025 are currently on track to be around 1.0 million—1.6 million less than in 2024 and 2.5 million less than in 2023. The contribution of NIM to overall U.S. labor force growth was quite large between 2022 and 2024, which tended to reduce labor market tightness. However, this contribution to labor force growth is projected to be much smaller in 2025.
Changes to net migration estimates
We build on the method in Duzhak (2024), which is closely related to the Congressional Budget Office’s approach (CBO 2024) to estimating the inflow of undocumented immigrants and NIM. Our previously updated estimates of inflows reflected a slight decline towards the end of 2024 (Duzhak and New-Schmidt 2024).
Using the most recent data from the Department of Homeland Security through May 2025, we estimate that NIM in 2024 was closer to 2.6 million, about 300,000 lower than we previously estimated and 100,000 lower than the CBO’s revised estimate.
Our analysis of the new data shows that inflows of undocumented immigrants have sharply declined in 2025, continuing a decrease in immigration that began in June 2024. If current rates of inflows hold, we project that NIM levels in 2025 may be as low as 1.0 million, about 1 million lower than the CBO’s current projection.
Why have our estimates for 2024 changed?
In previous analysis, we projected NIM levels for 2024 to be around 2.9 million (Duzhak and New-Schmidt 2024). Revised data and new assessments of immigration outflows and assumptions on undetected border crossings lead us to now estimate that net immigration in 2024 was around 2.6 million.
The revisions to the 2024 estimates are largely due to new data on the number of undetected immigrants and lower-than-projected inflows of undocumented immigrants for the fourth quarter of the year. For undetected entries we follow the CBO’s 2025 report that uses Border Patrol testimony to estimate that 800,000 people entered undetected in 2024, down from the previous estimate of 860,000.
However, the bulk of the drop in our estimate is because arrivals at or between ports of entry declined more quickly than expected in the fourth quarter. As Figure 1 shows, inflows at the end of 2024 for those groups (gold and light blue bars) were around 200,000, half of our November blog projections.
Overall, immigrant inflows declined more than expected last year, which has lowered our 2024 NIM estimate.
Figure 1
Inflow of Undocumented Immigrants to the United States
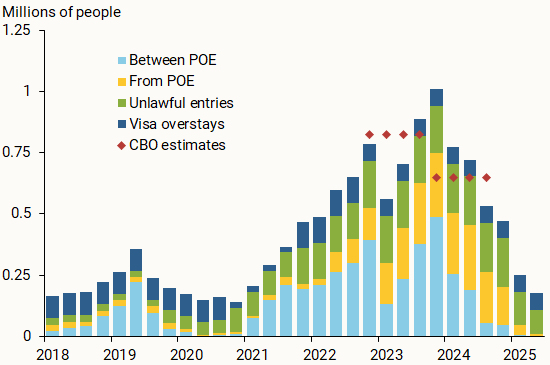
Source: CBO, Transactional Records Access Clearinghouse, U.S. Customs and Border Protection, and authors’ calculations.
What’s driving the 2025 decline?
Fewer undocumented immigrants arriving at or between ports of entry also led to a significantly lower 2025 NIM projection relative to 2023 and 2024.
Figure 1 shows that the inflow of undocumented immigrants declined from a peak of around 1.0 million in the fourth quarter of 2023 to around 180,000 in the second quarter of 2025. The largest decline comes from entries at or along the border (gold and light blue bars).
When immigrants are encountered either at a port of entry by the Office of Field Operations (OFO) or along the border by the U.S. Border Patrol (USBP), a number of different outcomes may occur. Migrants may be removed from the country, given a notice to appear in court, put on parole, released, or be subject to a few other outcomes depending on the circumstances of their arrival. Following the CBO, we assume that those given a notice to appear, put on parole, or released are all effectively “released” in the sense that they remain in the country.
Figure 2 shows that the overall number of encounters at the border have drastically declined since 2024, meaning significantly fewer people are coming into contact with border officials. The release rate, defined as the percentage of people encountered who are released into the country across OFO and USBP, has also dropped, as shown by the dark blue line in the figure. The decline in encounters and releases has occurred at both the southern border and elsewhere in the country, although releases at the southern border have fallen more sharply and are now at about the same level as releases from other borders. The release rate was about 10% in May 2025. This is about as low as the rate during the COVID-19 pandemic and during the early months of 2012, when the rate hovered around 12%.
Figure 2
Undocumented migrant encounters and releases
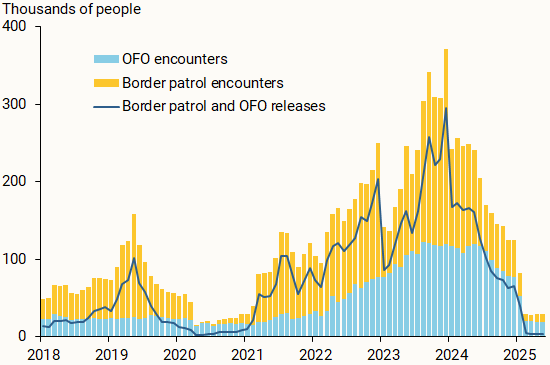
Source: U.S. Customs and Border Protection, Transactional Records Access Clearinghouse, and authors’ calculations.
Lower border encounters, together with stricter immigration policies, suggest a smaller number of unlawful entries. Therefore, we assume these numbers declined 50% since February 2025, making them similar to the levels observed in 2021.
However, NIM also includes the entry of lawful permanent residents and nonimmigrants like students and temporary workers, as well as immigrant outflows. Once we account for these, we estimate NIM will total about 1.0 million for 2025. This is less than half the total for 2024 and less than one-third the total for 2023 but is much closer to historical averages before the pandemic.
Our estimate for 2025 is significantly lower than the CBO’s estimate of 2.0 million, mainly because inflows have declined much faster than the CBO anticipated. The CBO’s model assumes that inflows decline about 25% each year from 2024 to 2028, leading to 1.95 million projected undocumented immigrant inflows in 2025.
In reality, however, inflows have dropped much more quickly. Estimates of inflows thus far this year total about 430,000. Assuming that rate holds steady, total entries for 2025 would be about 855,000, a 66% decrease from last year. If the number of encounters and releases at the border continue to decline in future months as they have thus far, total net immigration could be lower than 1.0 million. Additionally, higher detention rates and terminations of temporary protection status for many nationalities suggest that immigration outflow rates will increase, thereby reducing NIM numbers going forward.
Implications for labor force growth
Given the slowdown in the U.S. fertility rate and an aging baby boomer population, NIM has become increasingly important in supporting U.S. population growth (Duzhak 2023). Higher population growth translates into more workers entering the labor force and expanding U.S. economic activity. Data from the U.S. Bureau of Labor Statistics show that foreign-born individuals contributed more than half of total new workers to the labor force in the years 2022 through 2024. Going forward, lower NIM will likely slow down the inflow of new workers, which will tend to increase labor market tightness (Duzhak 2023) and could increase upward wage pressures for some groups of workers.
References
Congressional Budget Office. 2025. The Demographic Outlook: 2025 to 2055. Report, January 18.
Duzhak, Evgeniya. 2023. “The Role of Immigration in U.S. Labor Market Tightness.” FRBSF Economic Letter 2023-06 (February 27).
Duzhak, Evgeniya. 2024. “Recent Spike in Immigration and Easing Labor Markets.” FRBSF Economic Letter 2024-18 (July 15).
Duzhak, Evgeniya, and Addie New-Schmidt. 2024 “Immigration Surge Has Slowed: Updated Estimates of Net International Migration.” SF Fed Blog (November 21).
Related:


The views expressed here do not necessarily reflect the views of the management of the Federal Reserve Bank of San Francisco or of the Board of Governors of the Federal Reserve System.