Data and Indicators
The Economic Research Department provides recurring updates of specific data sets related to its research on the following topics:
U.S. Economy
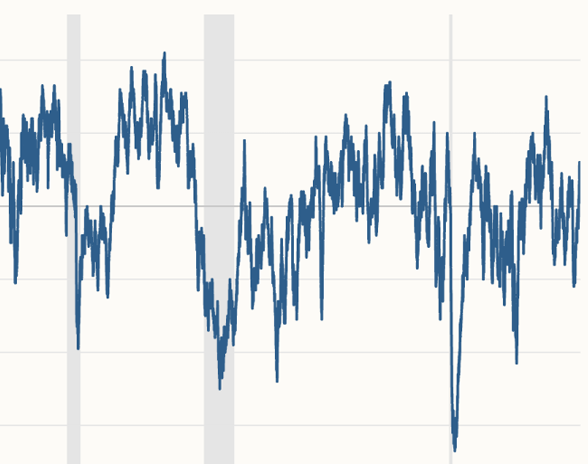
The Daily News Sentiment Index is a high frequency measure of U.S. economic sentiment based on lexical analysis of economics-related news articles.
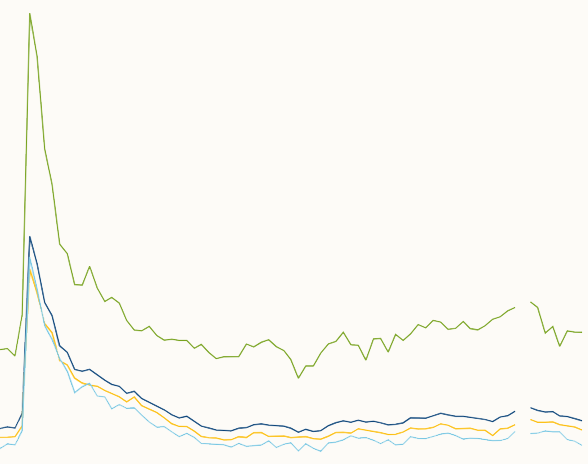
The SF Fed Data Explorer is an interactive tool that gives users the ability to explore, analyze, and download detailed data for various groups of people in the U.S. labor market. The data come from responses to the monthly Current Population Survey (CPS).
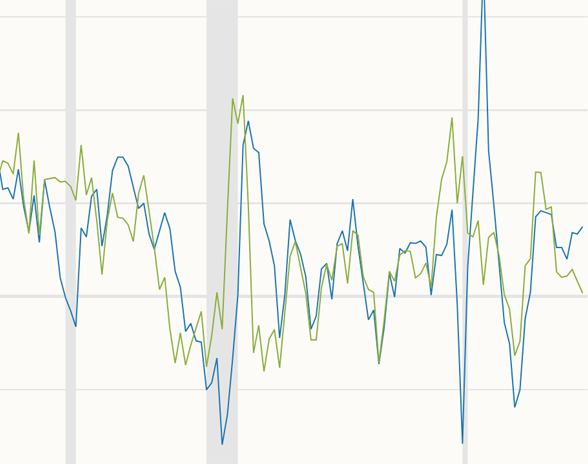
Total Factor Productivity (TFP) presents a real-time, quarterly data series for the U.S. business sector, adjusted for variations in factor utilization—labor effort and capital’s workweek.
Monetary Policy
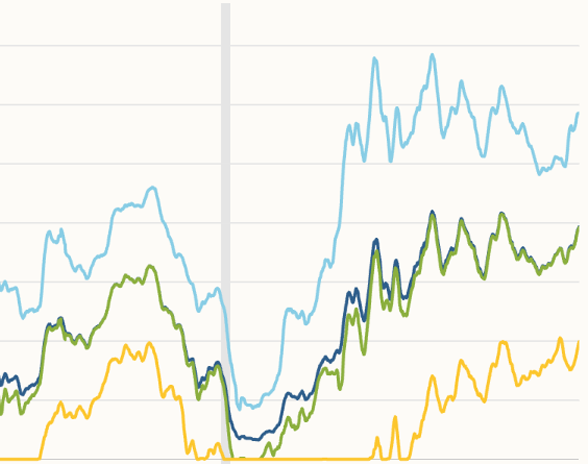
Interest Rate Probability Distributions is a daily measure of the distribution of future short-term interest rates, calculated from prices of fixed-income derivatives.
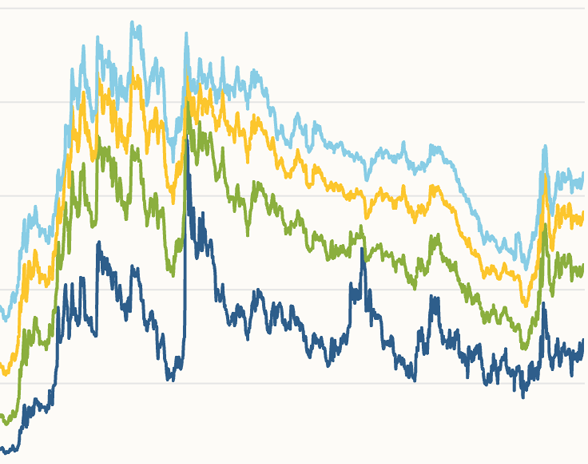
Market-Based Monetary Uncertainty provides daily indicators of the uncertainty about future short-term interest rates based on prices of money market derivatives.
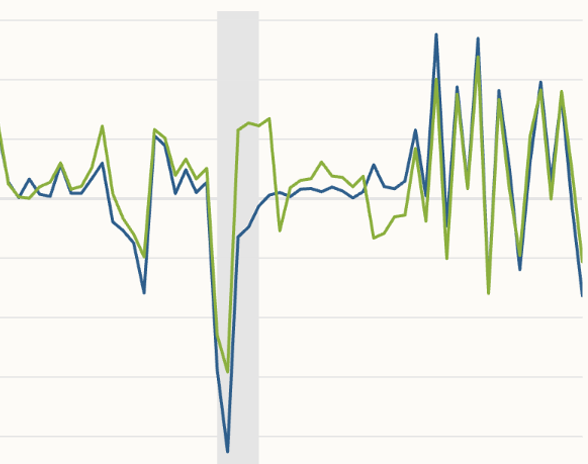
Monetary Policy Surprises captures the exogenous changes in interest rates over tight windows around FOMC monetary policy announcements.
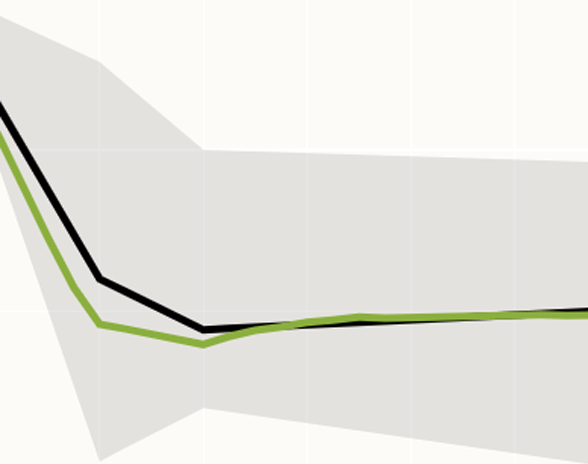
The Policy Calibration Tool computes the federal funds rate path that will best achieve the Federal Reserve’s dual mandate given the user’s views of the economy and interpretations of the mandate.
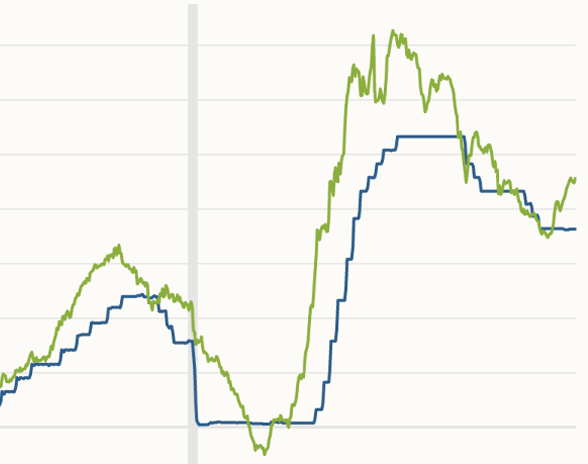
The Proxy Funds Rate uses a broad set of financial market indicators to assess the stance of monetary policy. The proxy rate can be interpreted as indicating what federal funds rate would typically be associated with prevailing financial market conditions if the federal funds rate were the only monetary policy tool being used.
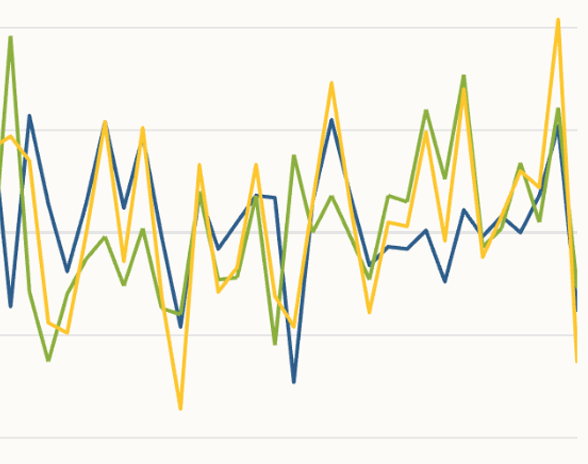
The U.S. Monetary Policy Event-Study Database collects high-frequency changes of interest rates and asset prices around Federal Open Market Committee (FOMC) communication events.
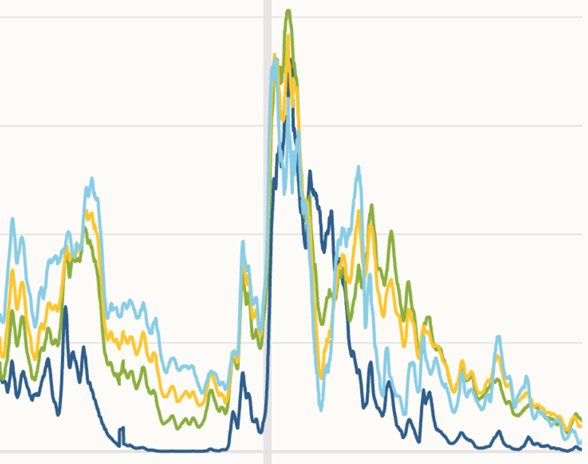
Zero Lower Bound Probabilities at Different Time Horizons uses prices of fixed-income derivatives to create a daily measure of the likelihood that future short-term interest rates will be constrained by the zero lower bound.
Inflation
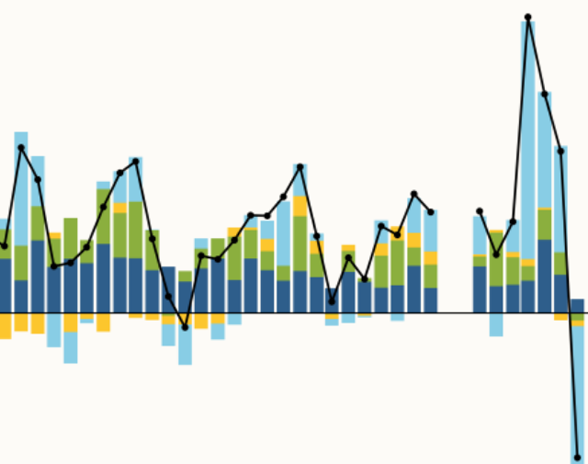
CPI Inflation Contributions from Goods and Services updates price changes of the typical goods and services that U.S. households consume to understand their role in driving changes in overall consumer price index (CPI) inflation.
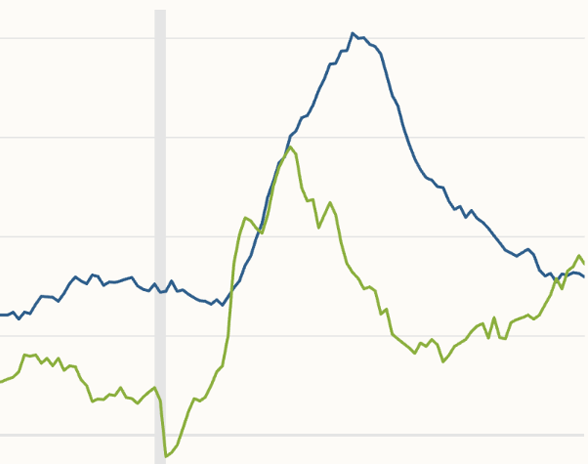
Cyclical and Acyclical Core PCE Inflation divides components of core personal consumption expenditures according to whether they move in tandem with economic cycles or are independent of the state of the overall economy.
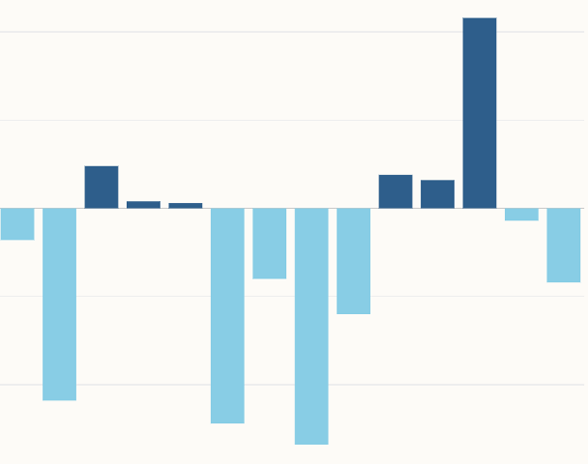
The Inflation Shock Momentum Index measures the share of PCE categories experiencing consecutive months of positive inflation shocks minus the share experiencing consecutive negative shocks. The index provides a real-time measure of inflation momentum across product categories.
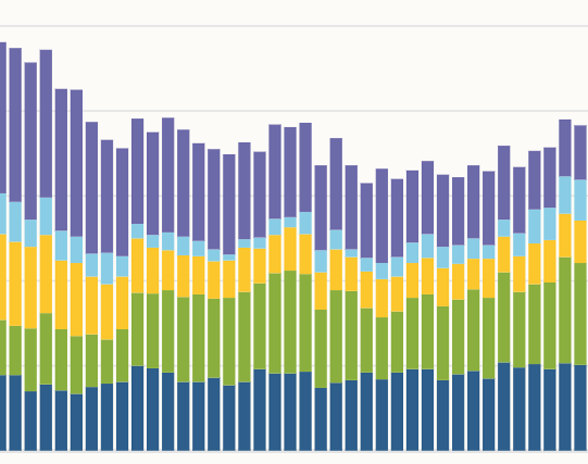
PCE Inflation Contributions from Goods and Services provides monthly updates on price changes for the broad categories of goods and services that U.S. households consume, as measured by personal consumption expenditures (PCE) inflation.
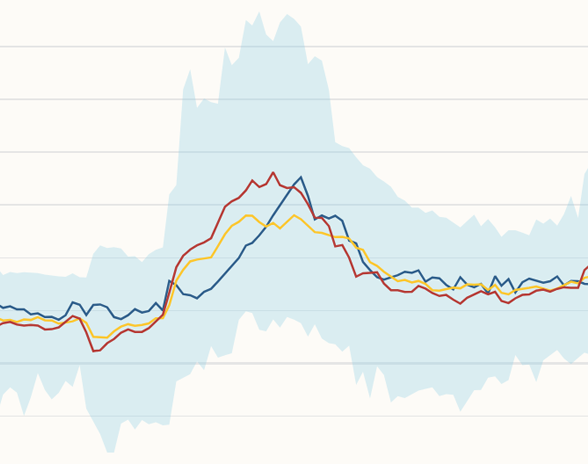
PCE Inflation Dispersion statistics present a more detailed summary of the personal consumption expenditure price index (PCEPI), a measure of U.S. inflation. Included are measures of the distribution of price changes across categories and diffusion indices.
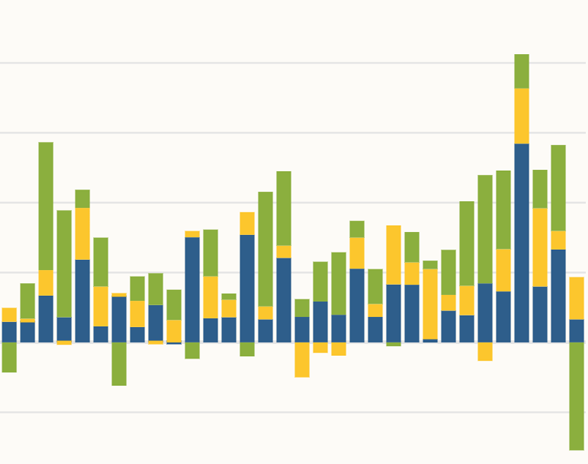
Supply- versus Demand-Driven PCE Inflation determines the monthly contributions to both headline and core personal consumption expenditures (PCE) inflation from supply-driven versus demand-driven components.
Labor Markets
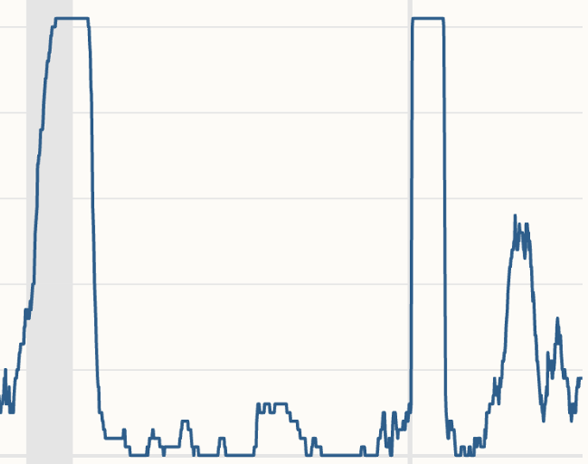
The Labor Market Stress Indicator tracks weekly state-level labor market developments in real time to better understand labor market conditions as they evolve.
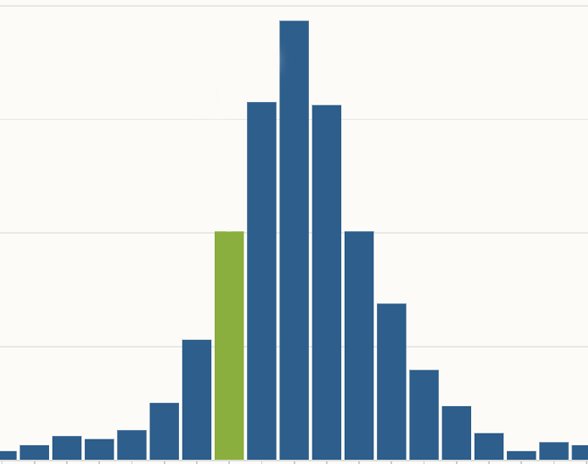
Revisions to Payroll Employment Gains in Historical Context visualizes a monthly assessment of volatility in U.S. payroll employment data based on revisions from the Bureau of Labor Statistics.
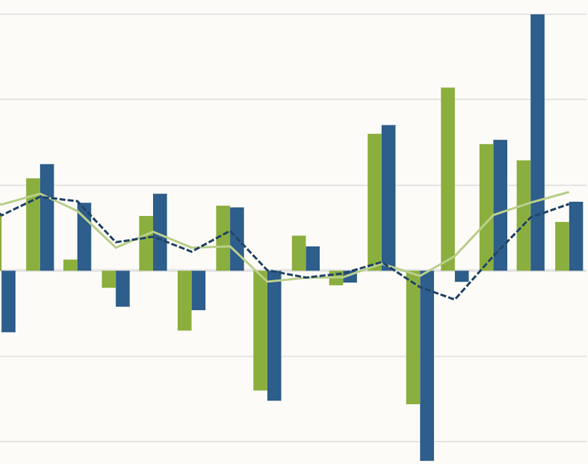
This page provides estimates of weather-adjusted employment change in the United States for the past six months. The estimates are aggregated from county-level estimates of weather’s employment effects, which were derived from a county-level analysis of the short-run effects of unusual weather on employment growth.
Financial Markets
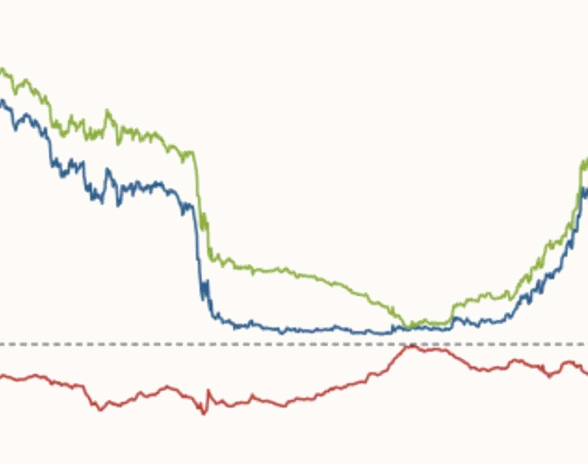
The Treasury yield premium model decomposes nominal bond yields of various maturities into three components: expectations of the average future short-term interest rate, a term premium, and a model residual.
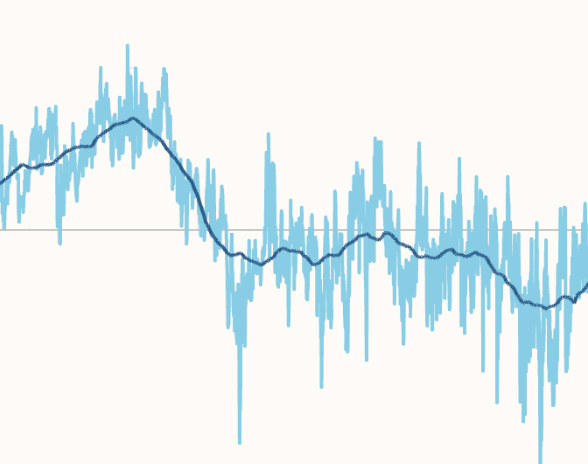
Treasury Yield Skewness provides daily indicators measuring the risks to the future outlook for interest rates based on prices of Treasury derivatives.
International Economy
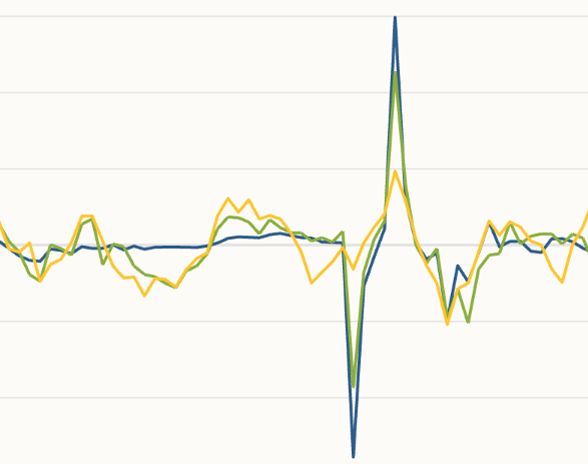
The China Cyclical Activity Tracker, China CAT, is an alternative measure of China’s economic growth based on research in Fernald, Hsu, and Spiegel (2019).
Regional Economy
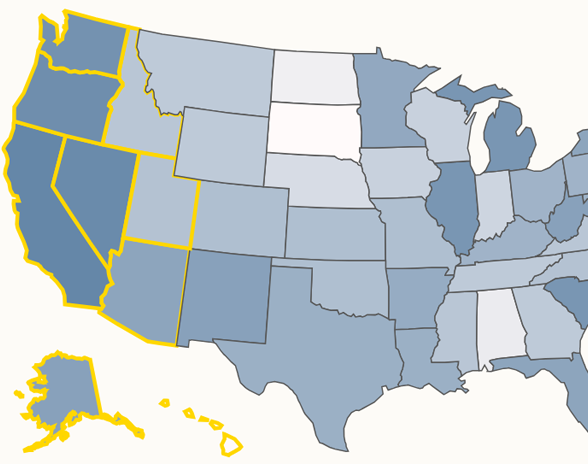
Regional data provide indicators measuring characteristics of the dual mandate across the nation. This page provides data on labor market conditions, prices, and earnings for the 50 states and the District of Columbia and also for selected metropolitan areas within the SF Fed’s 12th District.
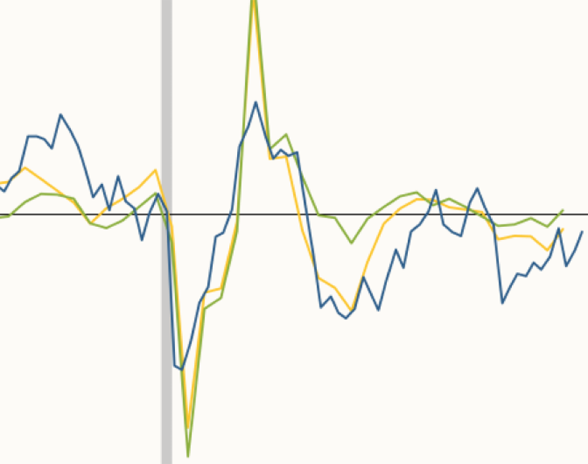
Twelfth District Business Sentiment presents two qualitative indexes—the SF Fed Business Sentiment Index for tracking economic growth and the SF Fed Inflation Gauge Index for inflation—based on information collected from business and community leaders across the western United States through Beige Book questionnaire responses.
Archived Data & Indicators
Pandemic-Era Excess Savings updates estimates of the remaining stock of aggregate excess savings in the U.S. economy, defined as the difference between actual savings and the pre-pandemic trend.
Featured Economists
Meet the authors of the research and data analysis featured on this page.
View All Economists