PCE Inflation Dispersion
Updated 9/30/2026
The personal consumption expenditure price index (PCEPI) is one measure of U.S. inflation, tracking the change in prices of goods and services purchased by consumers throughout the economy. Of all the measures of consumer price inflation, the PCEPI includes the broadest set of goods and services.
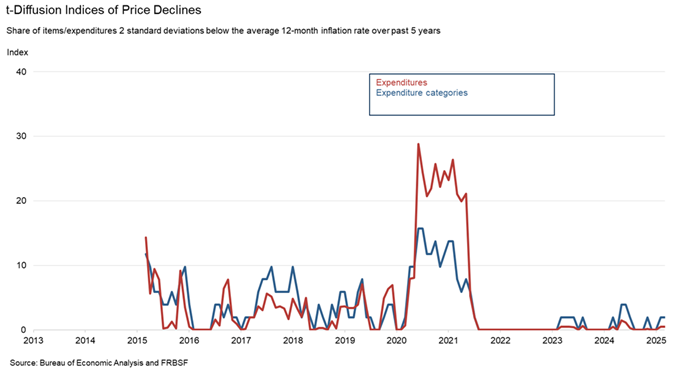
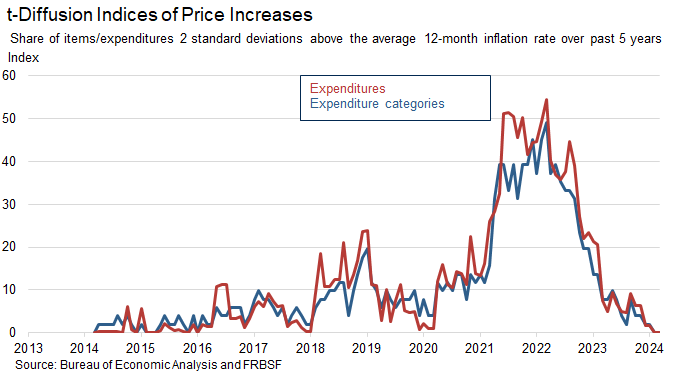
The PCEPI captures the average percentage change in prices across all categories within personal consumption expenditures. The statistics here provide a more detailed picture of these price changes. They include the distribution of price changes across categories of goods and services, for example, the median, 25th, and 75th percentile price change. Additional statistics include the distribution of price accelerations, calculated as the change in the inflation rate by category, diffusion indices that capture the share of total price changes that are either positive or negative, and t-diffusion indices that indicate the share of categories with price changes significantly higher or lower than their historical average. These statistics are calculated using the disaggregated personal consumption expenditure data on which the PCEPI is based.
Personal consumption expenditure data is released monthly as part of the Personal Income and Outlays Release of the Bureau of Economic Analysis. Following the release of the data, summary statistics will be updated within five days. Changes to this schedule will be published.
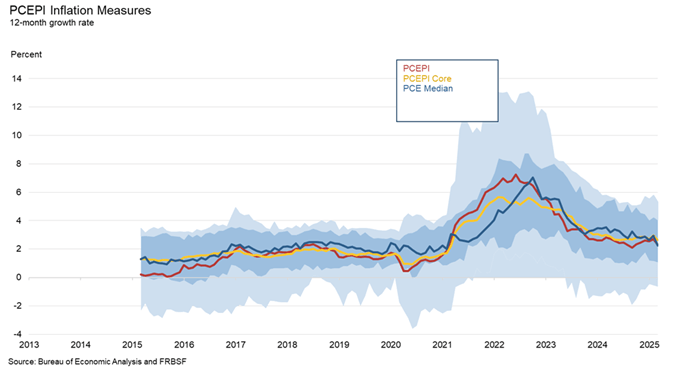
Displayed are the 12-month inflation rates of personal consumption expenditure price index (PCEPI), core PCEPI (this excludes food and energy), and the median inflation rate across personal consumption expenditure categories. These three series overlay the percentiles of inflation rates of the personal consumption expenditure categories. The lowest light-blue shaded area goes from the 10th to the 25th percentile, the dark-blue area is the inter-quartile range (25th-75th percentile) and the highest light-blue shaded area goes from the 75th to the 90th percentile.
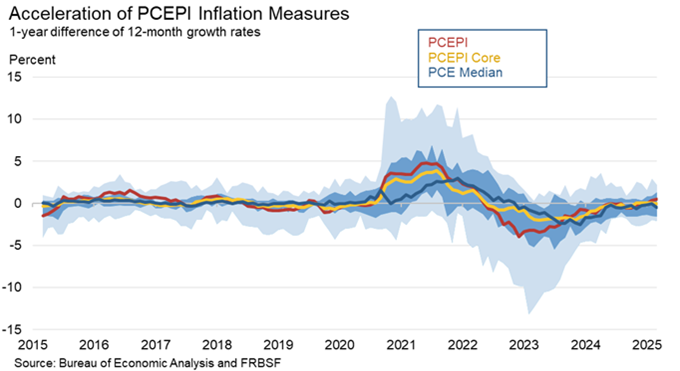
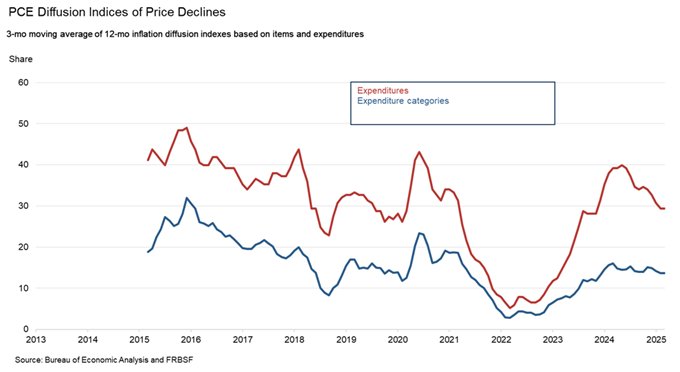
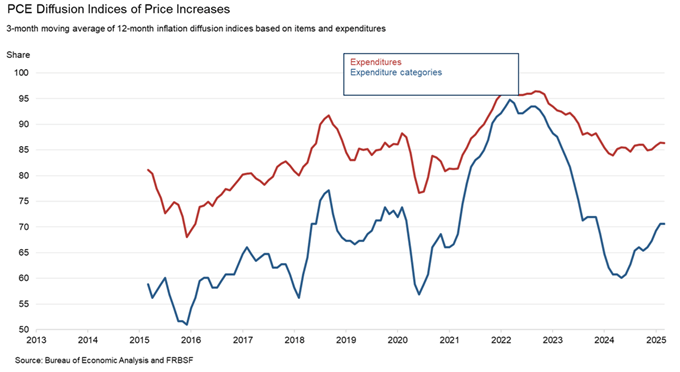
PCE Inflation Distribution and Dispersion Indicators
| PCE Measures – 12-Month Inflation Rates* | 8/26/2026 | 7/26/2026 | 6/26/2026 | 2/25/2026 | 8/25/2025 | Ten Year Average |
|---|---|---|---|---|---|---|
| Distribution of Inflation | ||||||
| Total | 3.42 | 3.36 | 3.45 | 2.80 | 2.69 | 2.81 |
| Core | 3.01 | 2.98 | 3.04 | 2.96 | 2.85 | 2.76 |
| 10th Percentile | 0.21 | -0.15 | 0.39 | -0.77 | -0.77 | -0.76 |
| 25th Percentile | 2.15 | 2.52 | 2.55 | 2.37 | 2.20 | 1.34 |
| Median | 2.99 | 3.10 | 3.13 | 3.04 | 3.13 | 2.96 |
| 75th Percentile | 3.67 | 3.50 | 3.92 | 3.76 | 3.88 | 4.53 |
| 90th Percentile | 5.16 | 4.81 | 5.49 | 5.01 | 5.32 | 5.84 |
| Change in Inflation** | ||||||
| 10th Percentile | -2.85 | -2.69 | -2.88 | -3.13 | -2.45 | -3.38 |
| 25th Percentile | -0.90 | -0.87 | -1.09 | -1.33 | -1.42 | -1.21 |
| Median | -0.42 | -0.17 | -0.20 | 0.03 | -0.06 | 0.11 |
| 75th Percentile | 0.25 | 0.38 | 0.47 | 1.19 | 0.91 | 1.46 |
| 90th Percentile | 3.89 | 3.33 | 3.32 | 1.95 | 3.01 | 3.36 |
| Dispersion of Inflation | ||||||
| Fraction of Items with Price Declines*** | 15.69 | 19.61 | 15.69 | 15.69 | 21.57 | |
| Fraction of Items with Price Increases*** | 84.31 | 80.39 | 84.31 | 84.31 | 78.43 | |
| Fraction of Expenditures with Price Declines*** | 7.12 | 9.50 | 7.65 | 9.20 | 10.59 | |
| Fraction of Expenditures with Price Increases*** | 92.88 | 90.50 | 92.35 | 90.80 | 89.41 | |
| Fraction of Items with t-declines**** | 3.92 | 5.88 | 5.88 | 0.00 | 0.00 | |
| Fraction of Items with t-increases**** | 3.92 | 3.92 | 3.92 | 3.92 | 0.00 | |
| Fraction of Expenditures with t-declines**** | 3.88 | 5.42 | 5.11 | 0.00 | 0.00 | |
| Fraction of Expenditures with t-increases**** | 2.84 | 0.34 | 0.73 | 0.73 | 0.00 | |
|
*Level 4 PCE Aggregates **12-month change of 12-month inflation rate *** Smoothed with 3-month moving average. ****Fraction of items or expenditures 2 standard deviations below the average 12-month inflation over the past 5 years. |
||||||
Download Data
PCE Data (CSV document, 809 bytes)
Releases Data by Month (Excel document, 4.0 mb)
Current Median CPI, Federal Reserve Bank of Cleveland
Trimmed Mean PCE Inflation Rate, Federal Reserve Bank of Dallas
Contact Aleisha.Sawyer (at) sf.frb.org