Friday, Mar 06, 2026
7:40 a.m. PT
New York, NY


President Daly’s panel discussion presentation on the value of private-sector data.
Transcript
The following transcript has been edited lightly for clarity.
Mary C. Daly:
Thank you very much. I really enjoyed reading the paper. I also enjoyed the presentation. I’d say the authors have kept working, because I think the presentation really focuses on the ideas even more than the draft of the paper did, so I like the continued work. As the authors just described, as Barry and Yuriy just described, the paper focuses on the value of private sector data, and it finds it complements official government statistics. And I want to just start where Yuriy ended. One of the most important graphs which Fiona showed was that the revisions from the BLS are getting smaller, not larger, and it just underscores that our official statistics are still robust. They’re a gold standard worldwide, and more investment in those types of collections, which have a long time series, is important. But of course, it doesn’t mean that you don’t need other resources, and so I would say that your findings in the paper are very consistent with Federal Reserve experience.
The FOMC has had a long history of using private-sector information that are now becoming publicly available, but this is about a long period of history, not a recent period of history, and the challenge is perennial. It’s not just about knowing that these private-sector data sources work or are effective. It’s about knowing when to use them, when their signal is important enough to act on it, versus it’s in a sea of signals that you’re also trying to collect about all the other variables.
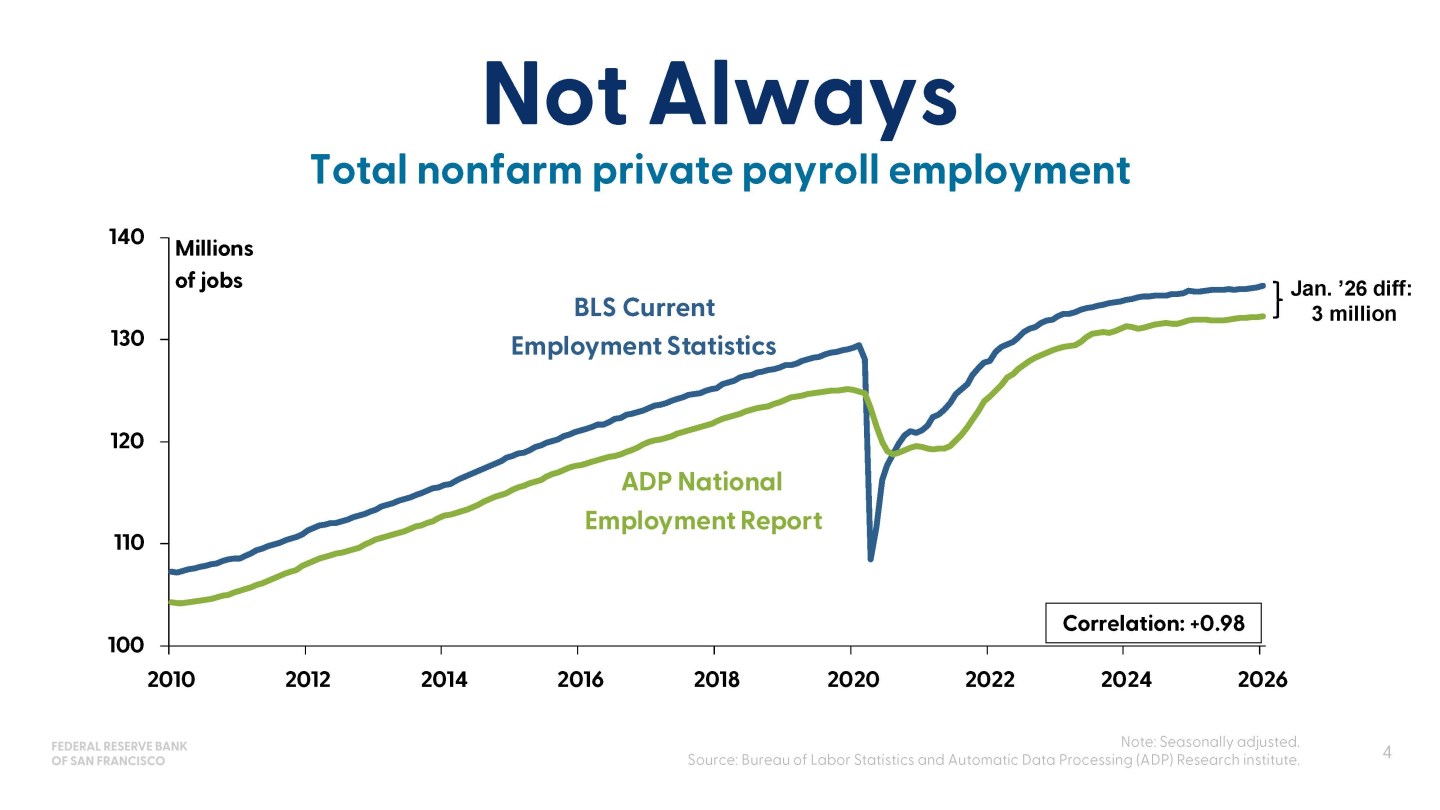
Let me start with the key question, do private-sector data help? I’m going to boil the answer down into two things. Not always, and here’s an example of not always. If you were just trying to see the trend in the two series, and these are the final prints of both series, you would see that the correlation is 0.98. So, we don’t really need them to know the long-run trends in the economy, but that’s actually not what we’re after when we’re making policy. We want to know fluctuations. I see the correlation, and you should see this in all private-sector resources that we would rely on, is very helpful, because if they’re not correlated overall, knowing what they do in the short run doesn’t really help you. So this is an important chart, and it just tells you … You don’t just use them constantly, but you do practice with them all the time, because sometimes you really need them.
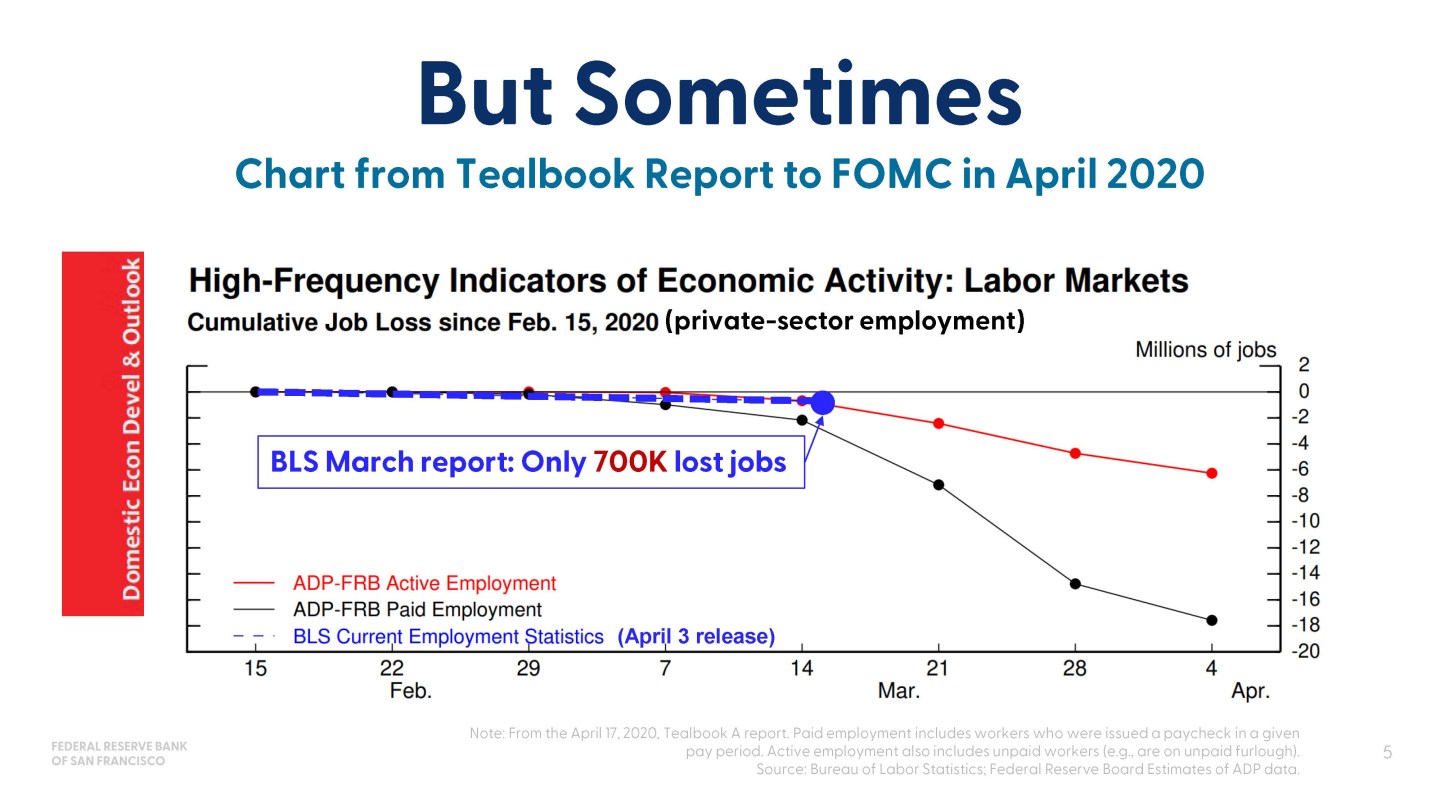
And let me tell you this sometime here. Now, Yuriy and authors said we’ve excluded the pandemic, but I’m going to use it because it’s in recently released transcripts. So, this is a screenshot from the Tealbook from April 2020, and we were having our late April FOMC meeting, and all we had from the BLS was the 700,000 job losses that came out in the report that we had available. Of course, we also had the ADP data, this is from the Tealbook, and that showed much more weakness than the lagged data that we had from the BLS.
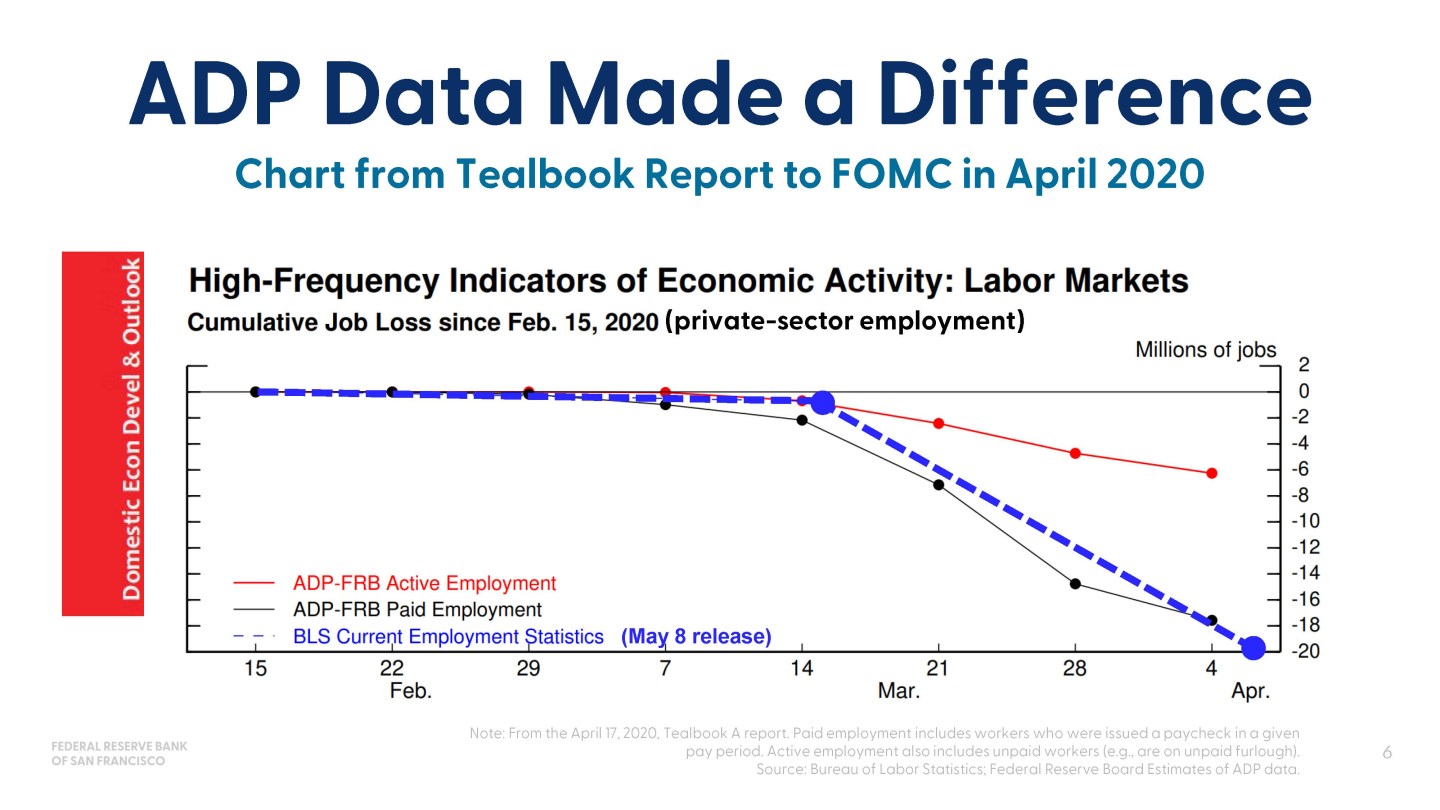
This was important because we were trying to understand just the depths of the distress that the pandemic was causing, and so we had early information. And what came to pass, we already moved the interest rate so there wasn’t much to do with the interest rate, but it allowed Chair Powell to go out and characterize what we thought was a true weakness in the economy. Of course, when we got the next release from May 8th, we found that the BLS data was in fact predicted by the ADP data, and this is confirming what the authors find in their overall part, but also shows that when we need it, we use it, and that was important.
The thing that I would like to remind everybody of, and the authors don’t focus on this, but Yuriy and Fiona both said it, is this is more than a labor market issue, and they have Vanguard and they have JPMC, but it’s just more than a labor market. I want to offer three examples from history that show you the other types of information we need, and some of it is coming from the Beige Book, but a lot of it comes from other methods of gathering private-sector data that are now being released by the firms that they actually collected for a long time.
So let’s go to the productivity boom. It’s everybody’s famous popular topic right now. What happened in the ’90s in the productivity boom? This is just a picture of the data we had available in early 1997 on productivity growth, and it was not very encouraging. Yet you can see productivity everywhere, except in the statistics, that’s the famous quote.
So you see that Greenspan and the policymakers who were thinking maybe we’ve got a productivity boom ahead of us, they found it, but they had to look in corporate profits, disaggregated public data, talking to CEOs, looking at today’s equivalent to using AI, looking at earnings reports. We had anecdotal reports, but we also toured factory floors and talked to people about how they were using computers and the internet to really make a change. And so policymakers, if you remember then, were able to hold off on a rate increase, even though inflation was around 3% and there was a lot of concern that the labor market was going to take off and maybe spur even additional inflation. So this was an example of collecting information beyond what just is in the published statistics that later comes to pass when you get a third or fourth vintage.
So another example that I’ve always found inspiring is President Poole’s, he was the St. Louis Fed President, he had a famous FedEx index. And so I pulled something from the transcripts for many of these things, if you want to entertain yourself on an afternoon. He has many of these types of quotes about FedEx, even created a little index, but he was anticipating the downturn that we eventually had in 2001, and he was using his FedEx contact. They do this for their business. They’re thinking about, “What is my demand going to be going forward?” And they counted how many people were using Express Mail, which you were then paying for by weight, and then also how many people were using ground. And they were seeing a big shift to very light packages in Express Mail and heavier ones in most packages going by ground. And he famously said this quote, and then of course we saw the recession in 2001.
My final example, I’m going to pull forward again to the pandemic, and it’s another private-sector data source, Zillow Observed Rent Index. So a big question for the FOMC in the post-pandemic inflation runup was when would housing inflation start to budge. Housing prices were continuing to rise even when we were raising the interest rate. When was this going to happen? So we used the Zillow Observed Rent Index. This was worked on at the San Francisco Fed, but other Board teams did it, et cetera. We used it to say, “Well, it’s going to come down. It just hasn’t gotten through the pipeline because we have to wait for people to renew their leases or sell their homes, and so there’s just a lag effect,” but that Zillow Rent Index ended up being a pretty good predictor of what we’re seeing now and last year in housing inflation.
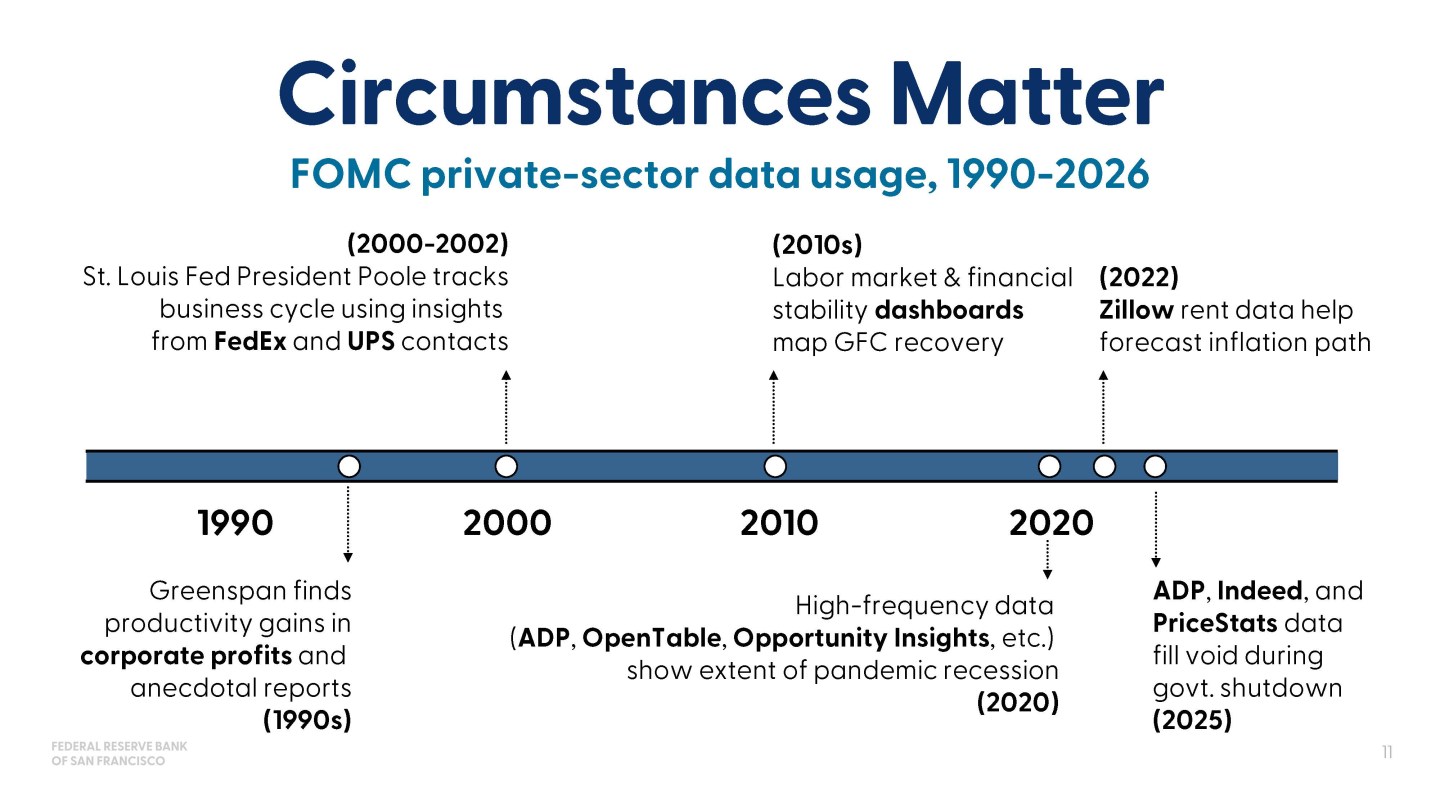
So what does all this mean? It just means that circumstances matter, which data of all the private-sector data that you might use if the circumstance really dictates what’s going to be the most material thing. So I put together a very short … It’s a long timeline, but just the examples I could fit on the page, but it goes everywhere from Greenspan using corporate profits and other things, Poole’s work. But in the labor market, in 2008, we used a labor market dashboard. We didn’t have ADP, but we had dashboards and indicators, and there were hundreds of these indicators that we hadn’t really previously relied on that we then relied on to try to make heat maps and figure out where the labor market was going and when it was ever going to come back to life, so to say.
In 2020, I think that’s a boom for using private-sector data because we just didn’t know what the … We didn’t have a lot of confidence in the official statistics, not because they were wrong, just because they were infrequently collected. And so we used everything from ADP to OpenTable, Opportunity Insights, et cetera. And even now, we’re using ADP, Indeed, PriceStats just to get a better read on the labor market. And I think it’s a good reminder that this effort that the authors have taken up to study it, that the effort that industry is taking to produce it and put it out is really valuable for policymaking.
So let me conclude though with looking at 2025, which was the example that Yuriy finished on. And you said it, Yuriy, but I think it’s worth remembering, it was a very interesting year. There’s a lot of uncertainty, uncertainty spikes. The administration has a slate of packages, deregulation, tax policy, the Big Beautiful Bill, tariffs, immigration, and all of those things were affecting businesses in the economy in a way that was not especially well known as it was evolving.
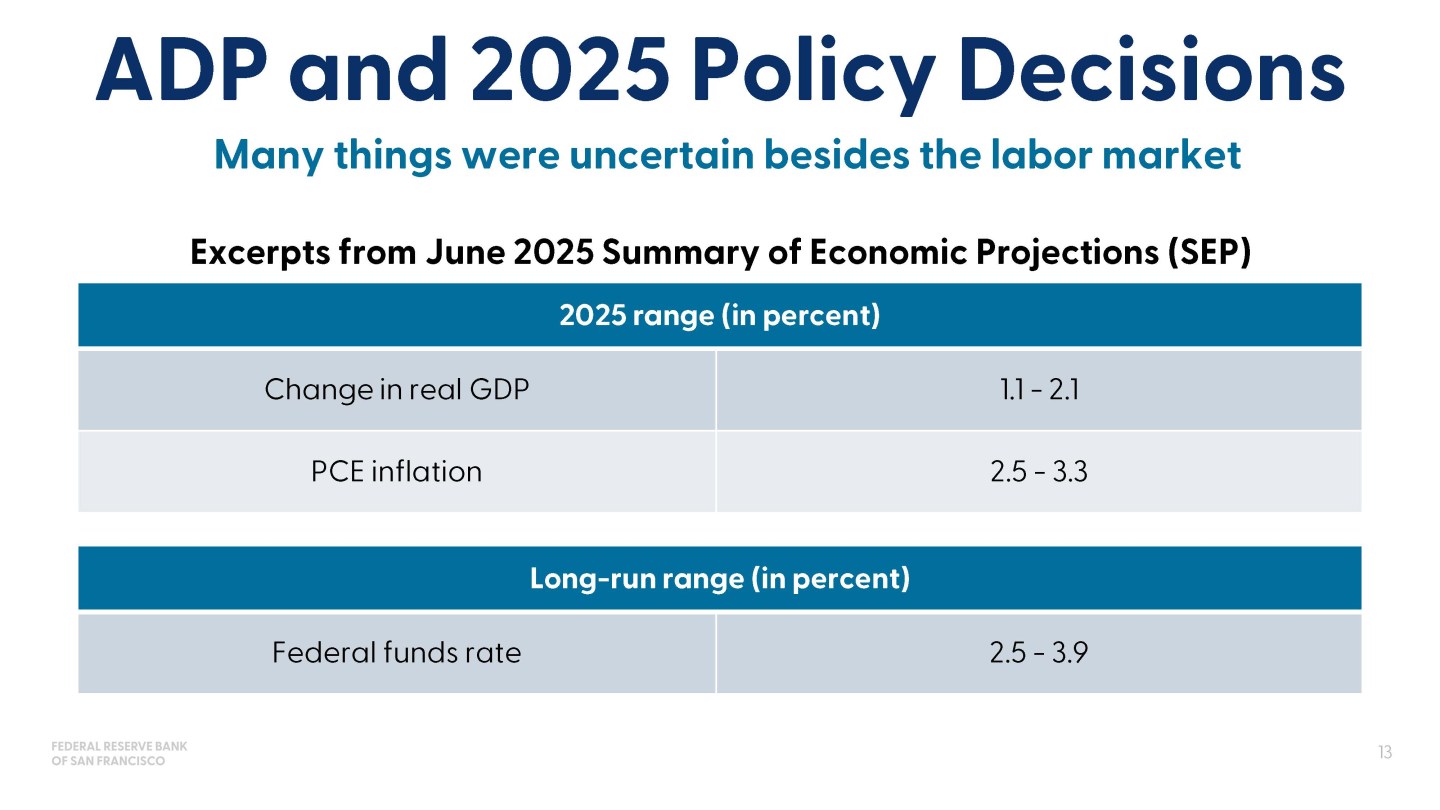
So when you think about it, would getting a little bit more information about the labor market earlier make a material difference in how early we lowered the interest rate? I would say it has to be taken in a context. So the policy decision, this is the June summary of economic projections, and other things besides the labor market felt uncertain. And in fact, if you just look at the 2025 range of participants’ estimates of GDP growth, it’s a percentage point of difference, everything from 1.1 to 2.1. The other is PCE inflation. It’s also quite dispersed. People were trying to sort out where they thought tariffs were going to have a big effect, a small effect. There was a discussion about that … You’d see this publicly by just looking at people’s public commentary, discussions about whether deregulation would be a growth and the tax bill would be a growth incentive that would offset some of the factors in tariffs. We didn’t know yet.
And then of course, the long run range, and this is the final row, of what people thought the Fed funds rate was, the nominal neutral, if you will. Vastly different over a percentage point of gap there, and that matters for how restrictive policymakers think we are or aren’t at any point in time. This is not to say that the ADP data aren’t helpful. They are helpful, and I think it’s one of the reasons several of my colleagues and I, not everybody, was a little more worried about the labor market than others as we’re looking at early information saying this doesn’t seem right, but you’re also trying to get more confidence that inflation’s coming down, that we understand the other parts on growth, what the growth effects are. And this just reminds us that monetary policy is a contextual decision that takes a lot of evidence, a lot of science, a lot of practice, but also some judgment, and that’s why we have a committee.
So you put it in sum, I’d say private sector data are helpful. Private-sector data are helpful for policymaking. I just think that’s unequivocally true. Policymakers have a long history of using them. As they become more ubiquitous and more firms share their data, exercises like the ones the authors do are essential. And I will give a shoutout to the Board of Governors staff and all the Reserve Bank economists who are working with academics and industry, trying to really get a sense of this. But this isn’t hopefully the last time I see a paper like this. More of these papers, it’s already part of a longer literature, but I think this is really important, because knowing when and how to use them is really what’s going to matter, and those circumstances can’t be looked through.
So if you’re just thinking about the paper, having a couple more event studies and not just the regressions and models – I think those are really useful; they ground you – but then a couple of places about when might you have been wrong if you relied too much on these predictions, and what would have been that in terms of a policy error? I always ask myself, if I knew more, would I have done something different in policy? And I think the answer’s often yes, but sometimes it’s not. Sometimes it’s no. And so I will just end with data must be paired with context and this good judgment and bringing some of that judgment into the paper and balancing off when it can be helpful and when we might not take a signal about it, that would be a terrific addition to the paper. So thank you very much, and I’ll give you a little time back.
Summary
President Mary C. Daly participated in a panel discussion on the importance of private-sector data in U.S. monetary policy making at the 2026 U.S. Monetary Policy Forum. The conference is sponsored by the Kent A. Clark Center for Global Markets at the University of Chicago Booth School of Business.
Sign up for notifications on Mary C. Daly’s speeches, remarks, and fireside chats.
About the Speaker

Mary C. Daly is President and Chief Executive Officer of the Federal Reserve Bank of San Francisco. In that capacity, she serves the Twelfth Federal Reserve District in setting monetary policy. Prior to that, she was the executive vice president and director of research at the San Francisco Fed, which she joined in 1996. Read Mary C. Daly’s full bio.
Related:


