


A comprehensive data revision shows the amount of pandemic-era excess savings still available in the U.S. economy may be larger than previously estimated—and is likely to last into the first half of 2024.
Earlier this year, we examined household saving patterns since the onset of the pandemic recession (Abdelrahman and Oliveira 2023a). Our study showed that, relative to previous recessions, households rapidly accumulated unprecedented levels of excess savings—defined as the difference between actual savings and the pre-recession trend—that amounted to about $2.1 trillion. In a subsequent update, our analysis suggested that pandemic-era excess savings were on track to be fully depleted during the third quarter of 2023 (Abdelrahman and Oliveira 2023b).
However, the Bureau of Economic Analysis (BEA) released a comprehensive update to its national economic data on September 28, which significantly expands our estimates of excess savings. This update included revisions to household spending and savings data since 2013. The BEA typically conducts its comprehensive updates every five years to incorporate the U.S. Census Bureau’s latest Economic Census results–the building blocks of BEA’s economic estimates–and to implement methodological changes when needed (Bureau of Economic Analysis 2023).
The BEA data update shows noticeable changes in household disposable income and spending before and after the onset of the pandemic recession. The revised data suggest that a larger fraction of aggregate excess savings remains in the economy than previously estimated.
Our updated estimates suggest that households held about $430 billion of aggregate excess savings by September 2023, and these excess savings are likely to continue being drawn down into the first half of 2024. To help track how this evolves, we have launched a monthly data page, “Pandemic-Era Excess Savings.”
Revisions show lower pre-pandemic savings trend
The BEA revised its historical estimates of disposable income and personal consumption spending, which we use in calculating excess savings. The changes affected data for both the pre-pandemic period and the period since the onset of the pandemic recession.
The pre-pandemic data changes altered our estimate of the pre-pandemic trend—that is, the hypothetical value of savings in the absence of changes stemming from the pandemic. Over the 48 months preceding the onset of the pandemic recession, nominal household savings were around $900 billion less than previously estimated. This is largely due to notable downward revisions by the BEA to estimates of household disposable income. The downward revisions mean that the pre-pandemic savings trend is significantly lower than previously published data suggested.
Revisions to March 2020 data and beyond were notable but smaller than those to the pre-pandemic data. The comprehensive update shows that household spending since the onset of the pandemic recession was around $500 billion higher than suggested by earlier estimates through July 2023, and that household disposable income was only about $150 billion higher. These combined revisions brought down the BEA’s measure of aggregate personal savings–defined as personal disposable income minus personal spending–by around $350 billion in recent years. In other words, households spent more and saved less.
Overall, the revisions resulted in a downward shift in the pre-pandemic trend line, which outweighed the downward revision to actual savings since the onset of the pandemic recession. Taken together, our estimates of pandemic excess savings—the difference between actual savings and the pre-recession trend—increased overall.
Higher excess savings remain in the economy
Figure 1 incorporates the recent data revisions to show how our updated estimate of cumulative excess savings in the aggregate economy changed following the BEA’s update. Figure 1 also incorporates the subsequent BEA data release for September 2023. Accumulated excess savings, estimated in nominal terms, totaled more than $2.1 trillion by August 2021 when it peaked. This is largely unchanged from the total pre-revision value.
Figure 1: Cumulative aggregate excess savings
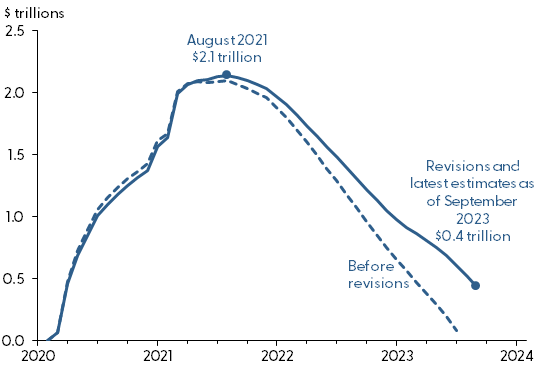
Source: Bureau of Economic Analysis and authors’ calculations.
Since then, the drawdown on household savings—that is, when aggregate personal savings dip below the pre-pandemic trend—has been slower than previously believed. The new estimates average about $75 billion per month, compared with $100 billion per month before the data revisions.
Figure 2 compares the latest post-revision measures of actual personal savings and the pre-pandemic savings trend. The red area shows our updated estimate for cumulative drawdowns. As of September 2023, this reached about $1.7 trillion of the $2.1 trillion in total accumulated excess savings (green area). This latest update implies that around $430 billion of excess savings remains in the aggregate economy.
Figure 2: Aggregate personal savings versus the pre-pandemic trend
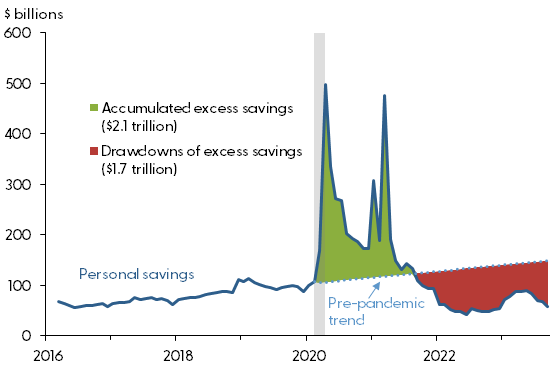
Source: Bureau of Economic Analysis and authors’ calculations.
If the recent pace of drawdowns persists—for example, at average rates from the past 3, 6, or 12 months—aggregate excess savings are likely to remain available in the overall economy until sometime in the first half of 2024.
Uncertainty ahead
Estimates of aggregate excess savings can be highly uncertain depending on both the methodology used and the assumptions made about the pre-pandemic trend. Moreover, further data revisions could materially alter our understanding of how households accumulate and spend savings.
Keeping this uncertainty in mind, our estimates suggest that a substantial amount of excess savings—around $430 billion—remains in the overall economy. Those funds are likely to continue being drawn down into the first half of 2024.
References
Abdelrahman, Hamza, and Luiz E. Oliveira. 2023a. “The Rise and Fall of Pandemic Excess Savings.” FRBSF Economic Letter 2023-11, (May 8).
Abdelrahman, Hamza, and Luiz E. Oliveira. 2023b. “Excess No More? Dwindling Pandemic Savings.” SF Fed Blog (August 16).
Bureau of Economic Analysis. 2023. Information on 2023 Comprehensive Updates to the National, Industry, and State Economic Accounts. October 2.
Related:


The views expressed here do not necessarily reflect the views of the management of the Federal Reserve Bank of San Francisco or of the Board of Governors of the Federal Reserve System.