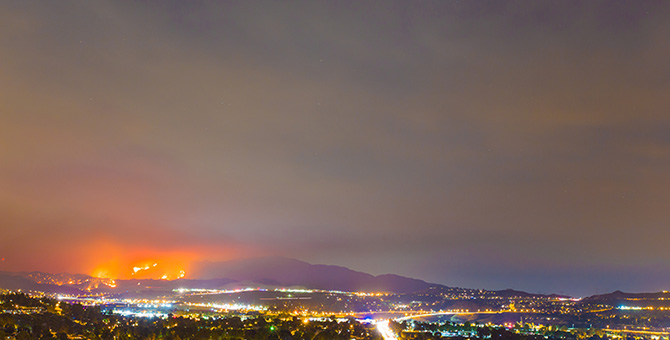
With summer comes the year’s highest temperatures, driest weather, and what residents across the Twelfth District are begrudgingly starting to refer to as “fire season.” It used to be that Southern Californians could wait until the Santa Ana winds arrive in the fall for fire weather to become a persistent worry. But in recent years, California fires have begun earlier and have been extending into the year-end holidays.1 The impacts of those fires spread well beyond the communities nestled in the forested hills of the state—also known as the wildland-urban interface..
The costs of fighting fires and managing drought and heat-stressed forests are immense,2 but so too are the impacts of the fires far from the burn scars. When smoke travels throughout the region, it can translate to health ills and costs, lost work and school days, fewer recreation dollars,3 and an overall decrease in a location’s desirability to residents.4
Where there’s fire: assessing the impact of smoke
Several times each day, satellites detect active fires on the Earth’s surface. Analysts at the National Oceanic and Atmospheric Administration (NOAA) then use satellite imagery to outline the visible smoke plumes from these fires, and the plumes are categorized as light, medium, or heavy smoke (see Figure 1). These smoke records can be combined with the locations of population centers to assess the frequency and amount of smoke a place has experienced. A forthcoming SF Fed analysis quantifies smoke levels across the U.S. going back to 2011 and the associated implications for different groups and their participation in the economy.
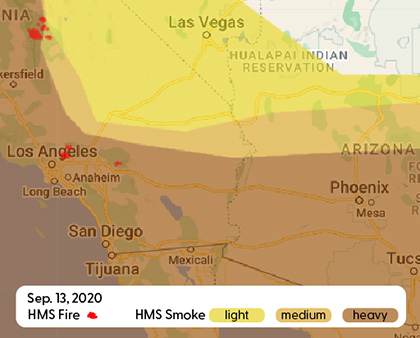
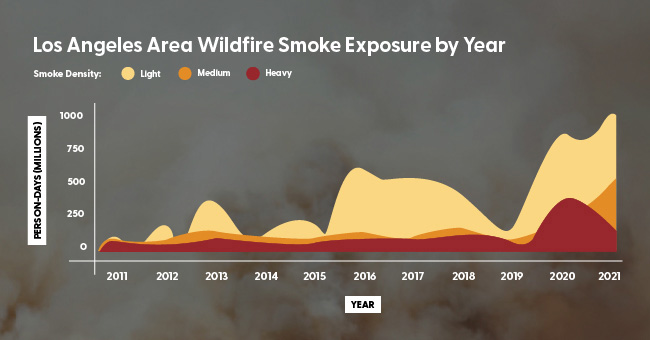
There has been a dramatic increase in disruptive and impactful smoke from fires in Southern California—home to the District’s largest metropolitan area—and in the West in general. In the 11 years of data, we observed increases in all three categories of smoke, with the largest increases in the heaviest smoke.
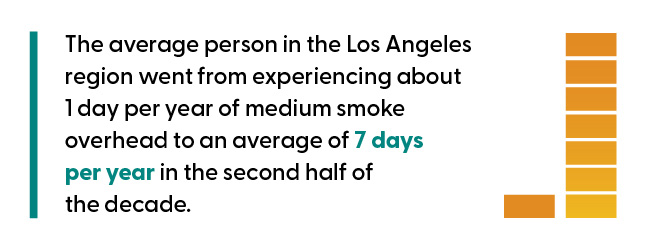
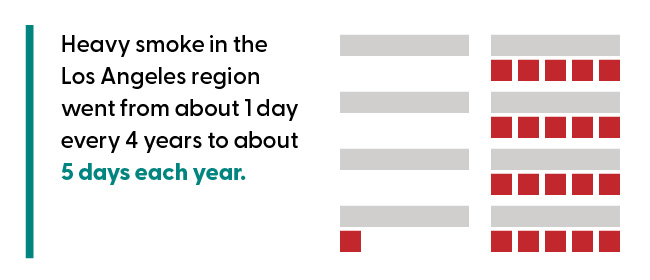
To quantify the potential exposure to smoke we use a “person-day” metric which is equivalent to one person being under a smoke plume for one day. When we compared the annual average person-days of smoke in the Los Angeles region from 2011–2015 to 2017–2021, there was a 1782% increase in person-days of heavy smoke exposure, independent of population changes over the period. The average person in the region went from experiencing about 1 day per year of medium smoke overhead to an average of 7 days per year in the second half of the decade. Heavy smoke went from about 1 day every 4 years to about 5 days each year.
Beyond burn scars: Understanding wildfire’s indirect impacts
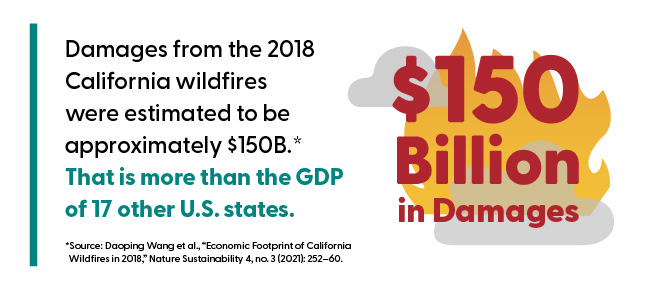
The economic consequences of fire and smoke increases are just becoming better understood. A study by Wang, et al. examining the economic impact of the 2018 California wildfires estimated the damages at about 1.5% of the state’s annual gross domestic product, or approximately $150B.5 Nineteen percent of that $150B was related to direct capital losses. Slightly more (22%) was associated with the negative health impacts of smoke-affected air quality. The majority of damages (59%) was attributed to indirect costs, via business interruption losses to industries often located far from the actual burn areas. Nearly a third (31%) of the $150B in losses were experienced outside of the state.
Another national study using the NOAA’s smoke plume data estimated that wildfire smoke exposures to led to economically significant losses in labor income, employment, and labor force participation.6 Each additional day of smoke (any density) was shown to reduce employment by as much as 80 employees per million eligible workers, and annually, smoke reduced earnings by almost 2% of U.S. labor income, on average.
While the 2018 wildfire season examined in the Wang, et al. study seemed to be an outlier for fire and smoke in California, state records show that total acres burned in 2018, which to that point had been a record-high, were surpassed in 2020 and 2021.7 The SF Fed’s work on smoke found that 2020 and 2021 smoke exposures in the region (Figure 2) were also several times as large as 2018, particularly for the heaviest categories of smoke. The persistence and severity of heavy smoke in the region may have consequences for the long-term desirability and economic development of the region. These health and indirect impacts are far less studied than the costs of active fire-fighting and property loss but may constitute a majority of the actual damages felt from large fires, particularly for large urban areas.
Implications for Communities
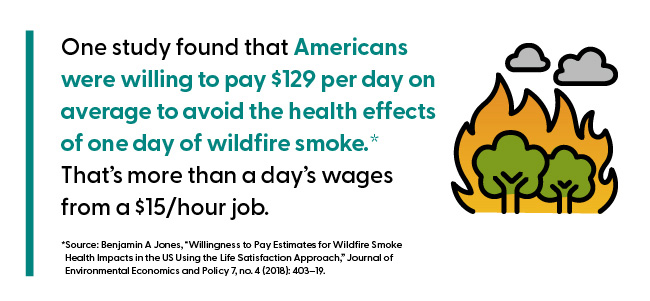
Recent work shows that while households are similarly aware of the presence of wildfire smoke, wealthier households are more likely to take protective actions, for example, closing windows and doors or wearing masks. Wealthier communities were found to be more likely to seek out protective devices like air filters, and may be able to more easily adjust lifestyles to avoid exposures, such as staying indoors with filtered air or evacuating temporarily. Because many of these self-protective actions rely on personal capital or access to credit, wealthier residents are more likely to benefit from them.8 One study found that Americans were willing to pay $129 per day on average to avoid the health effects of one day of wildfire smoke.9 That’s more than a day’s wages from a $15/hour job.
To understand how smoke in the LA region overlaps with these advantages, we used the Social Vulnerability Index (SVI) from the Centers for Disease Control and Prevention.10 The SVI uses U.S. Census data to determine the social advantage/vulnerability of communities, such as whether residents live in crowded housing. In Figure 3, darker areas highlight locations with the heaviest smoke exposures in the last decade and the least social advantage.
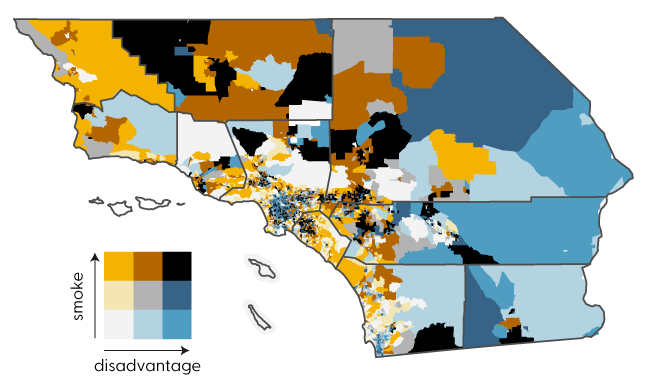
With smoke exposures increasing for every community in the region, it may be the case that economic risks can be moderated through smoke hazard mitigation for certain groups (Figure 3). The largest increases in the region were seen among communities with more multifamily housing,11 crowded households,12 minority populations,13 and individuals with limited English proficiency.14 Some communities have considered investments in wildfire smoke protections, like affordable housing and indoor air retrofits.
Additionally, sectors of the economy—including construction, agriculture, warehousing/transportation, and others that rely on outdoor workers—may be particularly sensitive to disruptions from smoke events.
As of the mid-point of 2022, smoke has been sparse and infrequent. However, if the recent past is any indication, many residents in Southern California—and across other parts of the San Francisco Fed’s District—are expecting disruptive and dangerous smoke to be part of life during the late summer and fall of most years.
The data behind this blog post are described in Vargo (2020)15 and are available for the entire United States. A full report on Trends and Character of Wildfire Smoke since 2011 is forthcoming.
Jason Vargo, PhD is a senior researcher in Community Development at the Federal Reserve Bank of San Francisco.
Brooke Lappe is a doctoral student in the Environmental Health Sciences program at Emory University’s Rollins School of Public Health.
1. Michael Goss et al., “Climate Change Is Increasing the Likelihood of Extreme Autumn Wildfire Conditions Across California,” Environmental Research Letters 15, no. 9 (2020): 094016.
2. Carolyn Kousky et al., “Wildfire Cost in California: The Role of Electric Utilities,” Changes 114 (2018): 4582–90.
3. Cloé Garnache and Frank Lupi, “The Thomas Fire and the Effect of Wildfires on the Value of Recreation Services in Southern California,” 2018.
4. Ellen Wohl, “Migration of Channel Heads Following Wildfire in the Colorado Front Range, Usa,” Earth Surface Processes and Landforms 38, no. 9 (2013): 1049–53.
5. Daoping Wang et al., “Economic Footprint of California Wildfires in 2018,” Nature Sustainability 4, no. 3 (2021): 252–60.
6. Mark Borgschulte, David Molitor, and Eric Zou, “Air Pollution and the Labor Market: Evidence from Wildfire Smoke” (National Bureau of Economic Research, 2022).
7. California Department of Forestry and Fire Protection (CAL FIRE), “Stats and Events,” n.d.
8. Marshall Burke et al., “Exposures and Behavioural Responses to Wildfire Smoke,” Nature Human Behaviour, 2022, 1–11.
9. Benjamin A Jones, “Willingness to Pay Estimates for Wildfire Smoke Health Impacts in the US Using the Life Satisfaction Approach,” Journal of Environmental Economics and Policy 7, no. 4 (2018): 403–19.
10. Centers for Disease Control and Prevention/ Agency for Toxic Substances and Disease Registry/ Geospatial Research, Analysis, and Services Program, CDC/ATSDR Social Vulnerability Index 2018 Database US. Accessed on June 17, 2022.
11. Housing structures with 10+ units
12. At household level (occupied housing units) with more people than rooms
13. all persons except white, non-Hispanic
14. Persons (age 5+) who speak English “less than well”
15. Jason A. Vargo, “Time Series of Potential US Wildland Fire Smoke Exposures,” Frontiers in Public Health 8 (2020): 126.
The views expressed here do not necessarily reflect the views of the management of the Federal Reserve Bank of San Francisco or of the Board of Governors of the Federal Reserve System.