Good afternoon. It’s a pleasure to speak to the Financial Women’s Association of San Francisco. My subject is how the U.S. economy is doing and where it’s heading. I’ll highlight where things are improving as well as some of the things that are holding us back. In doing so, I’ll take both a short-term and long-term look at the impact of fiscal policy on the economy. I’ll finish by going over measures we at the Federal Reserve recently announced aimed at boosting growth and getting us closer to our goals of maximum employment and price stability. As always, my remarks represent my own views and not those of others in the Federal Reserve System.
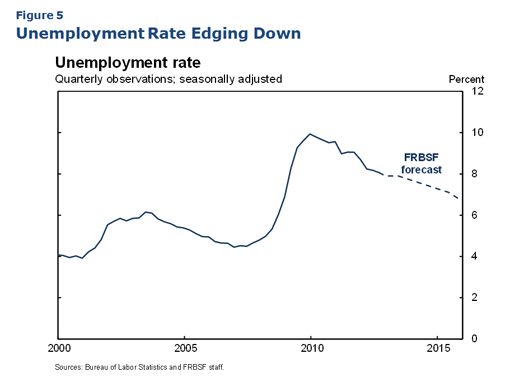
The events of the past five years have been tumultuous. We’ve lived through the worst financial crisis and recession in our country since the Great Depression. We still bear the scars of those events, but there’s no doubt our economy is on the mend.2 Private-sector payrolls have climbed for 31 consecutive months, adding nearly 4¾ million jobs.3 That’s more than half what we lost in the recession. After reaching a peak of 10 percent in October 2009, unemployment has declined by more than two percentage points to 7.8 percent. That’s real progress. But we’re still a long way from where we should be.
As for credit conditions, they’re much improved from a few years ago. For many borrowers, interest rates are at or near historic lows. And lenders seem more willing to extend credit. Consumer and business demand pent up during the recession is reviving. We can see that, for example, in car sales, which collapsed during the recession. Now, with auto financing rates at rock bottom and more people working, motor vehicle sales have climbed over 60 percent from their recession lows.
Another encouraging development is that housing is once more showing signs of life. Mortgage rates are at historically low levels and homes are extraordinarily affordable. Sales are rising, inventories have come down, and we’ve started working off the huge backlog of foreclosed properties. Nationally, home prices are starting to rise. Here in San Francisco, we can even say that the housing market is heating up.
The housing recovery includes a rebound in home construction, something particularly important for the health of the overall economy. Housing starts collapsed during the downturn, plummeting from a seasonally adjusted annual pace of over 2 million new units during the boom to around half a million in the depths of the recession. Such a dearth of homebuilding couldn’t continue if we were to have enough homes for a growing population. The latest data show housing starts rising to an annual rate of 750,000 units. That’s a big increase, but still well short of the longer-run trend of about 1.5 million units. Over the next few years, an ongoing recovery in housing construction should be one of the key drivers of economic growth.
I’ve highlighted a few sectors—autos and housing—that were hard hit during the recession, but are on their way back. Why then are we unable to shift into a higher gear of growth? Three reasons stand out: the European crisis, the budget squeeze at all levels of government in the United States, and a pervasive sense of uncertainty.
Europe’s problems have been a dark cloud hanging over global financial markets and our own economy for the past two years. What started as a financial problem in several European countries has morphed into a general economic downturn—and the shock waves are hitting us. U.S. companies are seeing lower demand for their products. The same is true for other countries that sell to Europe, such as China.
Recently, the European Central Bank announced a bold plan to stabilize the markets for government debt of countries under stress. Hopefully, this will buy enough time for European governments to put in place more comprehensive solutions for their banking and sovereign debt problems. But it is far from certain that European leaders will succeed in doing so. One challenge is that, in exchange for aid, authorities have demanded austerity measures, including tax increases and deep spending cuts. In the longer term, these measures are needed to put government budgets on sustainable paths. But, in the near term, austerity has held down economic growth further, prolonging economic downturns and making it tougher to trim budget deficits.
Europe is by no means the only thing pressing on the U.S. economy now. In our country, tax cuts and spending increases gave the economy a badly needed boost in the depths of the recession and early in the recovery. But these stimulus measures have been expiring. At the same time, states and localities have cut spending and raised taxes as they struggle to balance their budgets. As a result, fiscal policy in the United States has shifted from the accelerator to the brakes as far as growth is concerned.4
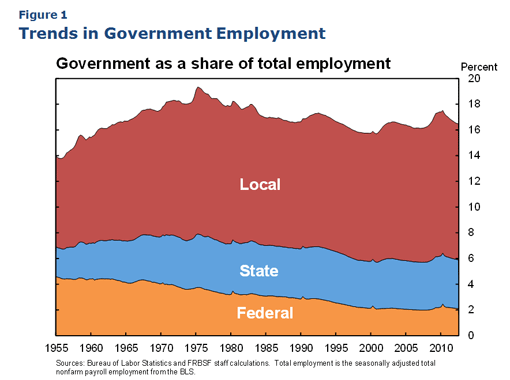
The numbers tell the story. Government consumption expenditures and investment have declined 5.3 percent over the past two years, adjusted for inflation. That’s equivalent to more than a 1 percent reduction in gross domestic product. Meanwhile, state, local, and federal government employment has fallen by 570,000 jobs, or 2½ percent, over the past four years.
Including these cuts, federal, state, and local government employment now make up about 16½ percent of all employment. Let me put that number in perspective. Figure 1 shows the trends in government employment as a share of total employment since 1955. The current government share is roughly the same as the average of the past 20 years, and well below the peak reached in the 1970s. Interestingly, federal employees constitute only about 2 percent of total employment today. That figure is less than half of what it was in the early 1960s.5
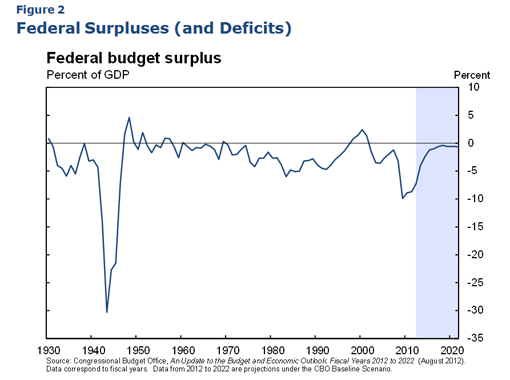
Of course, the elephant in the room in terms of fiscal policy are the huge federal deficits we’ve been amassing. Figure 2 shows federal deficits as a share of gross domestic product starting in 1930 and including projections by the nonpartisan Congressional Budget Office for the next 10 years based on current law. In recent years, taxes as a share of GDP fell to their lowest level since the early 1950s, while spending rose to its highest level. The result has been the widest deficits of the post–World War II era—over 10 percent of GDP in 2009 and projected still at 7 percent in 2012—requiring the government to borrow over a trillion dollars in that fiscal year.
This huge deficit is in part a product of the recession and slow recovery. As businesses closed and jobs disappeared, tax revenue fell. Meanwhile, spending soared as more people qualified for programs such as unemployment insurance. In addition, Congress and the White House boosted spending and cut taxes to stimulate the economy. Finally, unrelated to the downturn, tax rates put in place early in the past decade cut into federal revenue.
The drag on the economy could turn dramatically worse at the beginning of 2013. You may have heard the expression “fiscal cliff.” It refers to large federal tax increases and spending cuts that will automatically take place under current legislation. These include ending the temporary payroll tax cut and extended unemployment benefits. Caps on some federal outlays and sharp cuts in others are also set to go into effect. In addition, the Bush-era tax cuts are scheduled to expire. In Figure 2, you can see the fiscal cliff in the dramatic reduction in the federal deficit that would take place over the next few years under current law.
Now, I don’t expect all these tax hikes and spending cuts to take place as scheduled. For example, it’s likely that the Bush tax cuts will be extended temporarily and that some spending cuts will be deferred. Still, there’s little doubt that some austerity measures will hit, and that is likely to slow our economy’s progress.
If my prediction is wrong though, and the entire range of fiscal cliff measures stays in place, the effects on the economy next year would be much more severe. The Congressional Budget Office estimates that the complete fiscal cliff package would knock 2¼ percentage points off growth in 2013 and push unemployment up a percentage point compared with the less draconian scenario I expect. If that happens, the economy could find itself on the brink of recession.
Of course, fiscal policy is not the Fed’s responsibility. Under our system of government, Congress and the White House set the budget. Still, the Fed has a compelling interest because fiscal policy has such an important impact on the economy. Europe shows dramatically how government budget problems can wreak havoc with the economy.
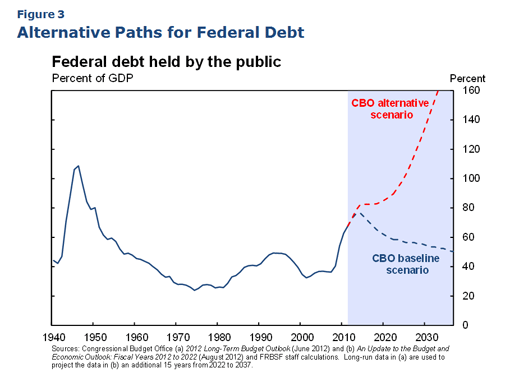
I’ve been talking about fiscal issues in the context of our economy today and in the period just ahead. I’d like to take a moment to discuss the longer-term budget picture. Figure 3 shows publicly held federal debt as a fraction of the economy. Publicly held debt has jumped from 36 percent of GDP in 2007 to a projected 73 percent this year. This can’t go on. One lesson from Europe is that there are limits to how big government debt can grow. If our debt gets too big, a crisis of confidence could erupt.
What happens depends on the choices we make. Figure 3 also shows two Congressional Budget Office projections for the federal debt.6 The baseline scenario assumes that all the fiscal cliff measures take place.7 What’s striking is that federal debt steadily declines as a share of GDP over coming decades. Compare that with the CBO’s alternative scenario, in which the Bush tax cuts are extended indefinitely and some spending cuts are suspended.8 Federal debt literally shoots off the chart, reaching 200 percent of GDP in a few decades.
This chart paints a scary picture. But it’s important to keep in mind that many combinations of spending and taxes could put us on a sustainable path. The fiscal cliff scenario is only one—and not the most desirable one, because of the damage it would do to the recovery. But as the nation moves toward a sustainable budget, we need to make wise choices about how to spend our money. And we must make sure we have the revenue to pay for this spending. How we tax and spend will affect economic growth and our standard of living. Let me sketch out some things we should keep in mind.
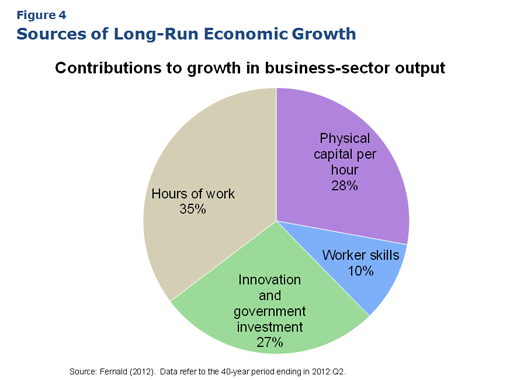
In the long run, economic growth depends not only on an expanding population, but also on how productive our people and businesses are. That productivity depends on our investments in factories and offices, equipment and technology, and worker skills. It also depends on our new ideas and innovations.
Figure 4 estimates how important each of these factors has been for economic growth. Over the past 40 years, total business output climbed nearly 3 percent per year on average. A little over a third of that reflects more hours of work as the labor force grew. But productivity has also risen because of our investments in, first, physical capital, including workplaces and equipment; and, second, education and skills training. A third factor, innovation and government investment, has also been vitally important.9
The private sector makes the most important contributions to these three productivity-enhancing factors. Businesses decide how much to invest in research and development, and plants and equipment. Private individuals decide what kind of training or education they want. But government plays a crucial role too. State, local, and the federal government spend around a trillion dollars annually on transportation and education. Education makes our workforce more productive. Public infrastructure, such as highways, ports, and airports, complements private business investment.10 And spending on national defense at the federal level and public safety at the state and local levels provide the security and protection of property rights necessary for our free market system to function.
Not least of all, the federal government funds about 30 percent of research and development. Plenty of R&D doesn’t produce quick returns for business, but contributes real value to society by laying the groundwork for future private-sector initiatives. Knowledge is by its nature a public good. Once it is gained, it can be reproduced at relatively little cost. As a result, the private sector tends to underinvest in creating new knowledge because businesses don’t take into account the full benefits to society. Instead, they are focused on the direct profits it produces.11 There’s no better example of a public good that sparked the development of a new industry than the Internet. It was a government and academic communication channel for years before it exploded into commercial success. Indeed, many of the technologies we take for granted today originated in government-funded basic research.
What all this means is that we must get our fiscal house in order. But, in doing so, we must continue to make the investments needed to make our economy more productive and competitive. Infrastructure, research, and education are three areas that must not be sacrificed as we fix our budget problems. That is, we must continue to plant the seeds for our future and not eat our seed corn.
We face a devilishly complicated balancing act. In the short run, we don’t want to jeopardize the recovery by moving too fast to slash spending and raise taxes. But, in the longer run, we must get spending and revenue aligned, trim the deficit, and keep the national debt from ballooning. At the same time, we should continue investing in areas that spur improvements in our standard of living.
Of course, these are contentious issues that must be resolved through political processes at all levels of government. This takes time, and can be disruptive and unsettling. It brings me to a third factor holding back the recovery—uncertainty. The crisis in Europe, the fiscal cliff, and, more generally, the tumultuous events of the past five years have made people unsure about the future and undermined the economic confidence that spurs spending and investment. Greater uncertainty causes households and businesses to boost saving out of fear over what lies ahead. With everyone hunkering down and preparing for the worst, businesses see a drop-off in demand for their goods and services. That in turn damps economic growth and drives up unemployment.12 Just about everyone I talk with stresses that uncertainty is holding back hiring and investment. Indeed, uncertainty about the economy—including federal fiscal policy—appears to have all but paralyzed some businesses, prompting them to postpone capital spending and payroll expansion.
I’d like now to offer my economic outlook and talk about what the Federal Reserve is doing to help keep our economy on the road of recovery, while keeping inflation low. Congress assigned the Fed two goals in setting monetary policy: maximum employment and price stability. I estimate that, right now, an unemployment rate of about 6 percent would be consistent with the Fed’s goal of maximum employment.13 In terms of the Fed’s other statutory goal—price stability—our monetary policy body, the Federal Open Market Committee, or FOMC, has specified that a 2 percent inflation rate is most consistent with our dual mandate.
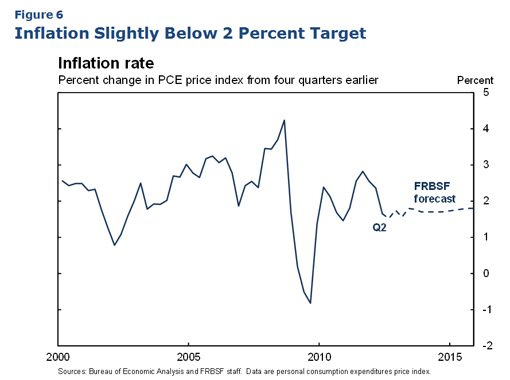
So, how are we doing? The current 7.8 percent unemployment rate is well above 6 percent. And progress on reducing unemployment has been uneven over the past year. As for price stability, inflation has averaged 1½ percent over the past year, below our 2 percent target.
Given this situation, it was essential that we at the Fed provide the stimulus needed to keep our economy moving toward maximum employment and price stability. So, at our policy meeting in September, we took two strong measures aimed at achieving this goal.14 First, we announced a new program to purchase $40 billion of mortgage-backed securities every month. This is in addition to our ongoing program to expand our holdings of longer-term Treasury securities by $45 billion a month. Second, we announced that we expect to maintain exceptionally low levels of our benchmark federal funds rate at least through mid-2015.
These actions work the same way monetary policy always does—by lowering borrowing costs and improving broader financial conditions.15 For example, low interest rates cut the cost of borrowing to buy a car, making people more willing to make the purchase. And, as car sales increase, automakers need to produce more cars and more parts, which leads them to hire additional factory workers and sales personnel. This is exactly the kind of virtuous circle that provides the oomph in a healthy economic recovery.
Thanks in part to the Fed’s recent policy actions, I anticipate the economy will gain momentum over the next few years. I expect real gross domestic product to expand at a modest pace of about 1¾ percent this year, but improve to 2½ percent growth next year and 3¼ percent in 2014. As Figure 5 shows, I see the unemployment rate gradually declining to about 7¼ percent by the end of 2014. And, as indicated in Figure 6, I expect inflation to remain slightly below 2 percent for the next few years as increases in labor costs remain subdued and public inflation expectations stay at low levels.
I should stress that our recently announced purchase program is intended to be flexible and adjust to changing circumstances. Unlike our past asset purchase programs, this one doesn’t have a preset expiration date. Instead, it is explicitly linked to what happens with the economy. In particular, we will continue buying mortgage-backed securities until the job market looks substantially healthier. We said we might even expand our purchases to include other assets. But, if we find that our policies aren’t doing what we want or are causing significant economic problems, we will adjust or end them as appropriate.
These policy actions are designed to help us achieve both our maximum employment and price stability goals. In no way has our commitment to price stability wavered. Over the past four years, the inflation rate has averaged a mere 1.3 percent, close to the lowest rate recorded over a four-year period since the mid-1960s. The Fed’s recently announced actions should help move inflation up a bit closer to our 2 percent long-run goal.
Monetary policy cannot solve all our economic problems. But it can help speed the pace of recovery and get our country back on track sooner. Our policy actions are completely consistent with the statement of longer-term goals and policy strategy the FOMC released in January.16 I’m convinced they represent the best course to move us closer to those goals. Thank you very much.
# # #
End Notes
1. I want to thank John Fernald and Sam Zuckerman for their assistance in preparing these remarks.
2. See Williams (2012a) for a discussion of the financial roots of the crisis and how they have affected the pace of recovery.
3. The employment gains since the recession are likely to be revised up, according to a preliminary announcement by the Bureau of Labor Statistics. Specifically, the BLS estimates that their upcoming benchmark revisions will add 453,000 private-sector jobs as of March 2012. The revisions will be implemented with the release of the January 2013 employment report. See BLS (2012).
4. See Lucking and Wilson (2012).
5. Data are for federal civilian employment. Uniformed military is currently about half the level of federal civilian employment. From 1960 to the late 1990s, military employment fell 45 percent and it’s been fairly constant since then.
6. The figure shows the most commonly used measure, which is known as debt in the hands of the public. That’s debt owned by individuals, corporations, state and local government, or foreigners. It excludes claims of one part of the federal government on the rest of the federal government.
7. The CBO baseline includes other assumptions, including that tax brackets and alternative minimum tax limits are never adjusted for inflation.
8. There are a number of other technical differences between the two projections. See CBO (2012a, b) for details.
9. The data come from Fernald (2012). The contribution of physical capital is capital’s share of income multiplied by the growth in the capital–hours ratio. The contribution of skills is measured as labor’s share of income times an index of labor quality. Broad innovation and government investment is a measure known as total factor productivity.
10. See, for example, Fernald (1999) and Leduc and Wilson (2012). Conceptually, the contribution of infrastructure belongs in the contribution of physical capital. However, the measure plotted in Figure 4 shows the contribution of nongovernment capital. For the period since 1972, a back-of-the-envelope calculation suggests that infrastructure could plausibly explain about one-tenth of what has been labeled innovation, or total factor productivity.
11. See Romer (1990) and Jones and Williams (1998).
12. See Bloom (2009) and Leduc and Liu (2012).
13. See Daly et al. (2012), Lazear and Spletzer (2012), and Williams (2012b).
14. See Board of Governors (2012b).
15. See Williams (2011).
16. For more information, see Board of Governors (2012a).
References
Bloom, Nicholas. 2009. “The Impact of Uncertainty Shocks.” Econometrica 77(3), pp. 623–685.
Board of Governors of the Federal Reserve System. 2012a. “Press Release.” January 25.
Board of Governors of the Federal Reserve System. 2012b. “Press Release.” September 13.
Bureau of Labor Statistics. 2012. “Current Employment Statistics: CES Preliminary Benchmark Announcement.” September 27.
Congressional Budget Office. 2012a. “The 2012 Long-Term Budget Outlook.” June 5.
Congressional Budget Office. 2012b. “An Update to the Budget and Economic Outlook: Fiscal Years 2012 to 2022.” August 22.
Daly, Mary C., Bart Hobijn, Ayşegül Şahin, and Robert Valletta. 2012. “A Search and Matching Approach to Labor Markets: Did the Natural Rate of Unemployment Rise?” Journal of Economic Perspectives 26(3, Summer), pp. 3–26.
Fernald, John G. 2012. “A Quarterly, Utilization-Adjusted Series on Total Factor Productivity.” Federal Reserve Bank of San Francisco Working Paper 2012-19.
Fernald, John G. 1999. “Roads to Prosperity? Assessing the Link between Public Capital and Productivity.” American Economic Review 89(3, June), pp. 619–638.
Jones, Charles I., and John C. Williams. 1998. “Measuring the Social Return to R&D.” Quarterly Journal of Economics 113(4, November), pp. 1119–1135.
Lazear, Edward P., and James R. Spletzer. 2012. “The United States Labor Market: Status Quo or a New Normal?” Paper presented at “The Changing Policy Landscape: The 2012 Jackson Hole Symposium.”
Leduc, Sylvain, and Zheng Liu. 2012. “Uncertainty, Unemployment, and Inflation.” FRBSF Economic Letter 2012-28 (September 17).
Leduc, Sylvain, and Daniel J. Wilson. 2012. “Roads to Prosperity or Bridges to Nowhere? Theory and Evidence on the Impact of Public Infrastructure Investment.” Federal Reserve Bank of San Francisco Working Paper 2012-04.
Lucking, Brian, and Daniel Wilson. 2012. “U.S. Fiscal Policy: Headwind or Tailwind?” FRBSF Economic Letter 2012-20 (July 2).
Romer, Paul M. 1990. “Endogenous Technological Change.” Journal of Political Economy 98(5), S71–S102.
Williams, John C. 2011. “Unconventional Monetary Policy: Lessons from the Past Three Years.” FRBSF Economic Letter 2011-31 (October 3).
Williams, John C. 2012a. “The Federal Reserve and the Economic Recovery.” FRBSF Economic Letter 2012-02 (January 17).
Williams, John C. 2012b. “Update of ‘What Is the New Normal Unemployment Rate?’” August 13 update to FRBSF Economic Letter 2011-05.
