

Last summer was one of consistently high temperatures, with the hottest July ever recorded and more than a third of Americans under extreme heat watch at times.1 Looking forward, summers of ‘extreme’2 heat are likely to be the norm.3 At the Federal Reserve Bank of San Francisco we are examining the ways that the increasing incidence of extreme heat affects the economy, and implications for local preparedness.
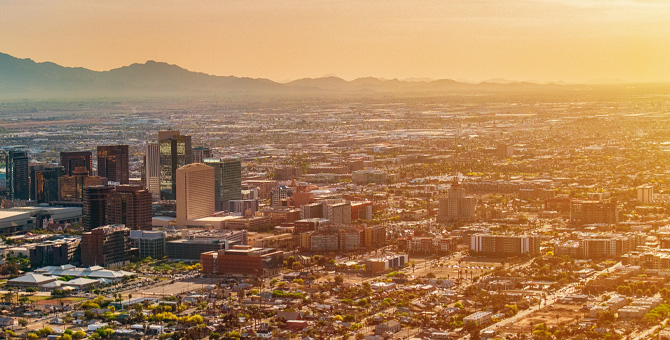
Figure 1
Trends in the frequency of high heat index days in Maricopa County, AZ
Source: First Street (FS).
There are a number of places impacted in the Federal Reserve’s 12th District, but there are few places where summer temperatures are as frequently high as in Phoenix, Arizona. In 2023, the city broke records with 54 days above 110F, including 31 days in a row reaching that mark.4 Days of extreme heat are expected to increase in Arizona. Maricopa County (where Phoenix sits) is projected5 to experience 100 days of extreme heat (heat index6 of 100 or greater) 30 years from now, up 69% from the historic (1950-2005) average of 59 days (see Figure 1). Certain groups experience greater levels of exposure to higher heat index days7 (see Figure 2).
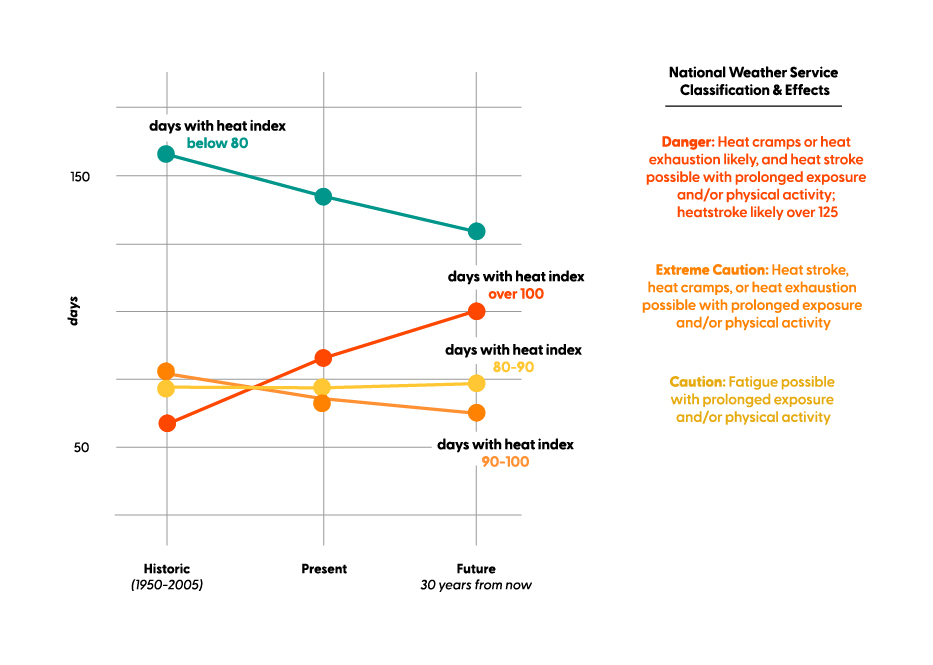
Figure 2
Future number of days with heat index above 100 for Maricopa County residents by household income
Source: First Street’s (FS) Extreme Heat Model, 2020 U.S. Census (race/ethnicity); 2020 American Community Survey 5yr data on household income.
In many ways, Phoenix—and Arizona more broadly—exemplifies the multiple ways extreme heat can affect the economy, including its impact on health-related losses, labor productivity, and energy consumption.
Health-Related Losses
According to data from the National Risk Index from the Federal Emergency Management Agency, statewide expected annual losses8 in Arizona due to heat waves are around $6 million, and two-thirds of these damages are attributed to death and injury. More than half (54%) of these losses occur in communities with poverty rates above 10%,9 which points to the role of economic circumstances in determining preparedness for to extreme heat risks. Arizona experiences seven times more heat related deaths than the other states in the San Francisco Fed’s District, and the health impacts of heat are a growing concern. Heat-related mortality in Arizona was four times larger in 2019 than it was in 2004.10
More than half of expected annual human health losses occur in communities with poverty rates above 10%, which points to the role of economic circumstances in determining preparedness for extreme heat risks.
Labor Productivity
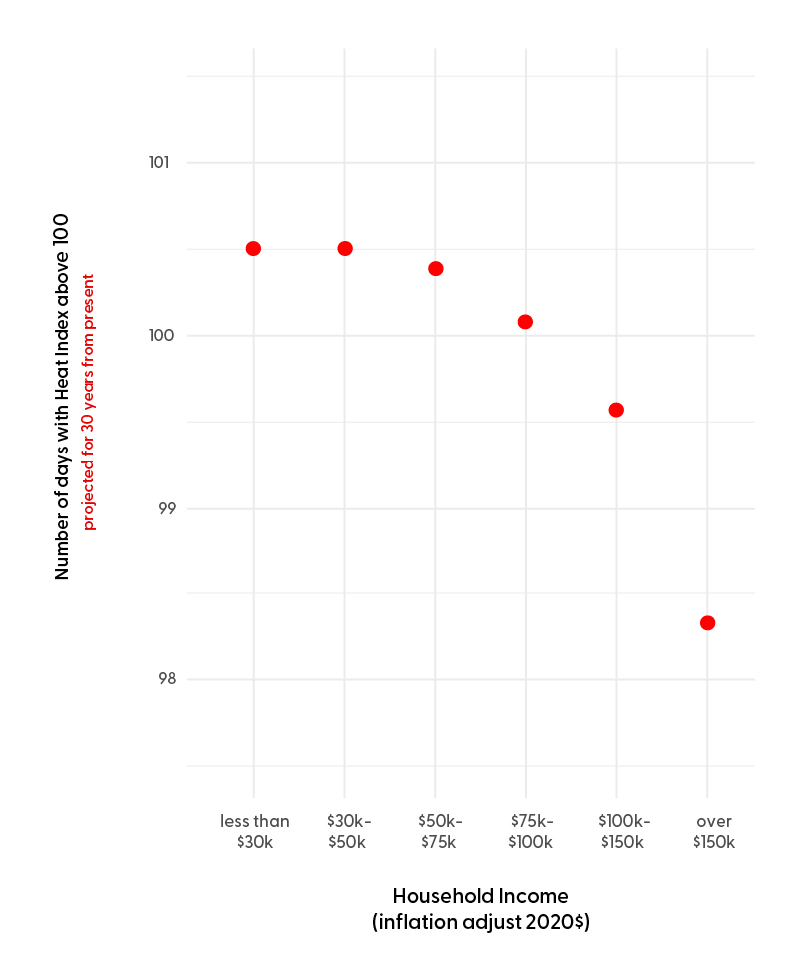
Frontline workers–those workers in outdoor occupations and often without access to indoor air conditioning–make up roughly 20% of the workforce in Phoenix.11 These tend to be lower-paying occupations (i.e., with typical annual earnings below the national median), and workers in these occupations experience greater impacts of extreme heat while at work (see Figure 3).12 Frontline workers are projected to lose a potential $2.6 billion in total annual earnings because of extreme heat by 2065, with Maricopa County being one of the hardest hit. The average Maricopa County outdoor worker could lose about $5,000 in earnings per year and 41 days of work lost (up from 13 days historically) due to extreme heat by 2065.13
Figure 3
Distribution of workers by selected occupation in Maricopa County, AZ
Source: American Community Survey 5-year 2020, variables C24010A:I “sex by occupation for the civilian employed population 16 years and over” by race/ethnicity and B24011 “occupation by median earnings in the past 12 months (in 2020 inflation-adjusted dollars) for civilian employed population 16 years and over”.
The average Maricopa County outdoor worker could lose about $5,000 in earnings per year, and 41 days of work lost (up from 13 days historically) due to extreme heat by 2065.
Energy Consumption
Based on analysis by First Street, this year Maricopa County is estimated to require energy for cooling on 294 days of the year, mostly via the use of air conditioning.14 In Maricopa County, electricity usage for cooling purposes is expected to increase by 6.4% over the next 30 years to 305 days per year. Changing energy need increased annual cooling costs for Maricopa residents by an estimated 17% since 2000.15 Increased demand can also put more pressure on the energy grid, leading to power outages. A study of several cities on concurring power failures and heatwaves estimated that heat mortality would increase by more than 700% in Phoenix if widespread power outages occurred—affecting almost 1% of the total urban population—compared to heat waves with no outages.16
Conclusion
While we detail a few ways local economies are facing the repercussions of extreme heat, this is not an exhaustive list. Extreme heat can also threaten infrastructure, lead to agricultural losses, and impact air travel. And, as with many natural hazards, low- and middle-income communities (LMI) are likely to experience outsized impacts across these multiple dimensions.17 Communities are addressing the well-being of low- and middle-income communities through proactive planning and infrastructure investments. MariSol Credit Union is an example of a mission-driven lender providing low-cost loans to LMI borrowers for air conditioning, and they are expanding their offerings for energy cost saving and resilience (ECSR) investments, such as home energy-efficiency retrofits, energy-efficient appliances, and solar panels.
The City of Phoenix is opening the nation’s first government office focused on heat response and mitigation. The office has been tasked with coordinating response, for example through providing heat relief supplies or emergency utility assistance, cooling station information, running a volunteer program aimed at preventing heat-related illnesses, or planting trees to reduce urban heat island effects.
While the Phoenix region may be at the forefront of extreme heat’s impacts and related costs, much of the nation is experiencing growing frequency and intensity of extreme heat.18 A forthcoming research brief will provide details on many of these impacts for LMI workers and communities, and will provide deeper insights and available data for communities in the 12th District.
Brooke Lappe is a doctoral student in the Environmental Health Sciences program at Emory University’s Rollins School of Public Health.
Jason Vargo is a senior researcher in Community Development at the Federal Reserve Bank of San Francisco.
Elizabeth Kneebone is assistant vice president of Community Development Research at the Federal Reserve Bank of San Francisco.
Endnotes
1. National Oceanic and Atmospheric Administration (NOAA). June marked by record-setting U.S. heat waves, severe weather. https://www.noaa.gov/news/june-marked-by-record-setting-us-heat-waves-severe-weather.
2. The definition of ‘extreme’ heat varies depending on the context, purpose, and specific dataset. Temperatures may be considered relative to historic norms, as in studies examining heat wave intensity over time where threshold temperatures associated with a percentile (e.g., 98th percentile) for an area (e.g., temperatures from 1950-1980) can be used to define extreme values. Temperatures may also be defined absolutely, as is often done by the National Weather Service, such that extreme heat occurs when temperatures or the heat index reach a certain threshold deemed hazardous to human health (e.g., over 100F may trigger heat warnings).
3. Vose, R.S., D.R. Easterling, K.E. Kunkel, A.N. LeGrande, and M.F. Wehner, 2017: Ch. 6. Temperature changes in the United States. In: Climate Science Special Report: Fourth National Climate Assessment, Volume I. Wuebbles, D.J., D.W. Fahey, K.A. Hibbard, D.J. Dokken, B.C. Stewart, and T.K. Maycock, Eds. U.S. Global Change Research Program, Washington, DC, USA, 185–206. https://doi.org/10.7930/j0n29v45
4. Associated Press. “Phoenix hit 110 degrees on 54 days in 2023, setting another heat record” Sep 10, 2023. https://www.pbs.org/newshour/nation/phoenix-hit-110-degrees-on-54-days-in-2023-setting-another-heat-record
5. First Street property-level climate data. First Street. (2021).
6. The heat index is a combination of temperature and humidity and what the temperature feels like to the human body when relative humidity is combined with the air temperature. This has important considerations for the human body’s comfort. When the body gets too hot, it begins to perspire or sweat to cool itself off. (National Weather Service)
7. This only accounts for temperature differences across the county and where people live. It does not account for differences in exposures due to say, occupation.
8. For details on expected annual losses see FEMA’s methodology at https://www.fema.gov/sites/default/files/documents/fema_national-risk-index_technical-documentation.pdf#page=193
9. Federal Emergency Management Agency (FEMA) National Risk Index (NRI) and Centers for Disease Control and Prevention (CDC) Social Vulnerability Index (SVI)
10. CDC Environmental Public Health Tracking Network https://ephtracking.cdc.gov/
11. Occupations include outdoor workers such as agriculture, natural resources, construction, warehousing.
12. U.S. Census Bureau, Real Median Personal Income in the United States [MEPAINUSA672N], retrieved from FRED, Federal Reserve Bank of St. Louis; https://fred.stlouisfed.org/series/MEPAINUSA672N, February 2, 2024.
13. Dahl, Kristina, Rachel Licker. 2021. Too Hot to Work: Assessing the Threats Climate Change Poses to Outdoor Workers. Cambridge, MA: Union of Concerned Scientists. https://doi.org/10.47923/2021.14236
14. Source: First Street. https://riskfactor.com/county/maricopa-county-az/4013_fsid/heat#heat_energy_usage
15. First Street property-level climate data. First Street. (2021).
16. Stone et al. Compound Climate and Infrastructure Events: How Electrical Grid Failure Alters Heat Wave Risk. Environ Sci Technol. 2021 May 18;55(10):6957-6964. https://doi.org/10.1021/acs.est.1c00024.
17. Mattiuzzi, Elizabeth, and Eileen Hodge. 2021. “Climate-Related Risks Faced by Low- and Moderate Income Communities and Communities of Color: Survey Results.” Federal Reserve Bank of San Francisco Community Development Research Brief 2021-3. https://doi.org/10.24148/cdrb2021-3
18. Habeeb, Dana, Jason Vargo, and Brian Stone. “Rising heat wave trends in large US cities.” Natural Hazards 76 (2015): 1651-1665.
Related:


The views expressed here do not necessarily reflect the views of the management of the Federal Reserve Bank of San Francisco or of the Board of Governors of the Federal Reserve System.