


Understanding employment patterns among different segments of the nation’s workforce contributes to a deeper understanding of the economy, in support of the Federal Reserve’s monetary policy goals. Lower-income workers, in particular, often experience barriers to participating and advancing in the labor market and achieving financial stability. In our recently released report, we analyzed 2023 American Community Survey microdata to deepen our understanding of the composition and employment patterns of workers in lower-income households, across the nation and within the Federal Reserve’s Twelfth District.
Our analysis reveals that 28% of the U.S. workforce—48.9 million people—live in a lower-income household (households with earnings below 80% of the typical household income in their community). More than 10 million of those workers live in the Twelfth District.
While most lower-income workers work full-time (65% work 35 hours a week or more), the majority of workers in a lower-income household (52%) earn less than $25,000 a year. This population tends to skew younger and have lower levels of educational attainment than average (Figure 1). And lower-income workers tend to hold jobs in occupations that pay below the typical weekly earnings of the workforce as a whole, including Office and Administrative Support, Sales, Food Preparation and Serving, Construction and Extraction, Production, and Material Moving occupations. These occupations account for roughly half of the jobs held by workers in lower-income households.
Figure 1.
Education and Earnings Levels of Workers by Income Status, 2023
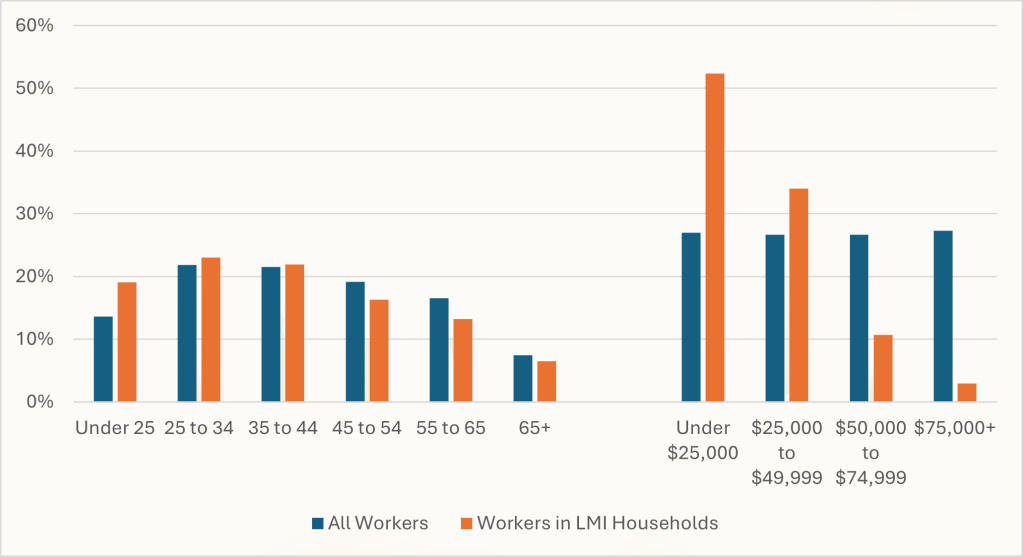
Source: Author analysis of 2023 American Community Survey Public Use Microdata
Note: All differences are significant at the 95% confidence level.
View chart data in tables
Table 1.
Education Levels of Workers by Income Status, 2023
| Earnings | All workers | Workers in LMI Households |
|---|---|---|
| Under $25,000 | 27% | 52% |
| $25,000 to $49,999 | 27% | 34% |
| $50,000 to $74,999 | 27% | 11% |
| $75,000 plus | 27% | 3% |
Table 2.
Education Levels of Workers by Income Status, 2023
| Earnings | All workers | Workers in LMI Households |
|---|---|---|
| Under $25,000 | 27% | 52% |
| $25,000 to $49,999 | 27% | 34% |
| $50,000 to $74,999 | 27% | 11% |
| $75,000 plus | 27% | 3% |
To learn more about this segment of the workforce—and to find data for the nine Western states included in the Twelfth District—check out the full report. We will continue to explore employment and economic conditions among workers in lower-income households in future research, including assessing the extent to which emerging technologies, such as generative AI, stand to impact the jobs of lower-income workers. Understanding how these employment patterns and conditions may be changing for workers in lower-income households can offer important insights in efforts to increase economic participation and mobility for these workers.
Related:


The views expressed here do not necessarily reflect the views of the management of the Federal Reserve Bank of San Francisco or of the Board of Governors of the Federal Reserve System.