By Keith Wardrip, Federal Reserve Bank of Philadelphia, and Kyle Fee and Lisa Nelson, Federal Reserve Bank of Cleveland
College-educated workers typically have greater success in the labor market than do workers without a bachelor’s degree (hereafter sub-baccalaureate workers), as measured by both earnings and rates of employment.1 In light of research indicating a “polarization” of the labor market in favor of higher- and lower-wage jobs,2 it is worth asking the question: Do certain regional economies offer greater opportunity than others for the more than two-thirds of adults without a bachelor’s degree?
Our research explores the jobs available in 121 of the largest metro areas in the U.S. In each, we divide employment into one of three categories based on the annual median wage and the educational expectations of employers hiring to fill open positions:
- Opportunity employment is accessible to sub-baccalaureate workers and typically pays above the national annual median wage ($37,690), adjusted up or down to reflect the local cost of living (i.e., the local wage threshold). Occupations characterized by a high level of opportunity employment are referred to as opportunity occupations.
- Equally well-compensated jobs that aren’t accessible to sub-baccalaureate workers are classified as higher-wage employment requiring a bachelor’s degree.
- Lower-wage employment can be found in occupations that pay below the local wage threshold.
The remainder of this post briefly summarizes our findings for 10 metro areas in the Twelfth Federal Reserve District: Anchorage, AK; Boise City, ID; Los Angeles-Long Beach-Anaheim, CA; Phoenix-Mesa-Scottsdale, AZ; Provo-Orem, UT; Salt Lake City, UT; San Francisco-Oakland-Hayward, CA; Seattle-Tacoma-Bellevue, WA; Stockton-Lodi, CA; and Urban Honolulu, HI.
Twelfth District Findings
Opportunity employment takes many different forms. As Table 1 illustrates, the largest opportunity occupations in these 10 metro areas represent a true cross-section of the economy, ranging from health care (registered nurses) to the skilled trades (carpenters and electricians) to office work (accounting clerks and administrative supervisors). However, the individual character of a regional economy emerges when looking at the top 10 in each metro area. For example, medical assistants in Anchorage, licensed practical/vocational nurses in Los Angeles, and computer support specialists in Provo are top-10 opportunity occupations in these markets, even though they are not among the largest sources of opportunity employment in the Twelfth District.
Table 1
Largest Opportunity Occupations (2017)
| Rank | Occupation | Jobs Classified as Opportunity Employment |
|---|---|---|
| 1 | Registered Nurses | 161,056 |
| 2 | Heavy and Tractor-Trailer Truck Drivers | 103,990 |
| 3 | Carpenters | 78,680 |
| 4 | Bookkeeping, Accounting, and Auditing Clerks | 73,550 |
| 5 | General and Operations Managers | 65,062 |
| 6 | Supervisors of Office and Administrative Support Workers | 61,290 |
| 7 | Electricians | 59,130 |
| 8 | Sales Representatives, Services | 56,307 |
| 9 | Sales Representatives, Wholesale and Manufacturing | 50,397 |
| 10 | Police and Sheriff’s Patrol Officers | 50,066 |
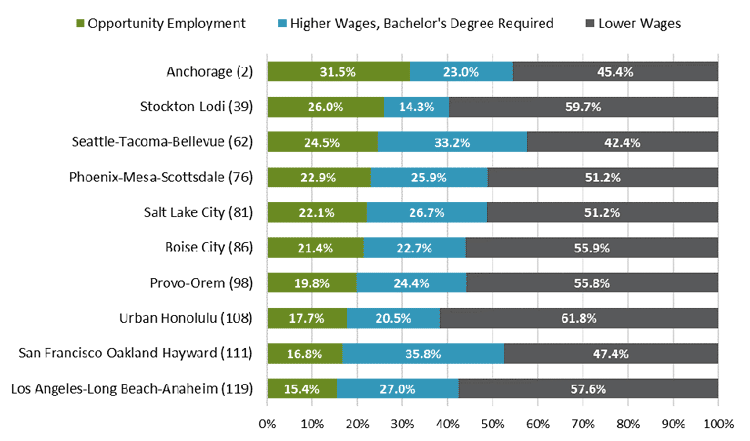
Just as the largest opportunity occupations vary somewhat from place to place, we find that opportunity employment as a share of total employment varies regionally, as well. As Figure 1 illustrates, the opportunity employment share ranges from 31.5 percent in Anchorage – second-highest among the 121 metro areas included in the full study – to 15.4 percent in Los Angeles, which ranked 119th. The juxtaposition of Stockton and Seattle in Figure 1 also highlights how the balance of employment can vary across regional economies. Stockton’s economy consists of relatively few higher-wage jobs requiring a bachelor’s degree and a significant level of lower-wage employment, while the reverse is true in Seattle.
Figure 1
Distribution of Employment by Wages and Education (2017)
Sources: Authors’ calculations using data from BLS Occupational Employment Statistics (May 2017), Burning Glass Technologies (2015–2017), BEA Regional Price Parities (2016), and American Community Survey Five-Year Public Use Microdata Sample (2012–2016)
Our research also allows us to disentangle the effects of several factors that influence a regional economy’s level of opportunity employment, including the mix of occupations, the level of education that employers seek when filling open positions, and the area’s cost of living. By comparing actual opportunity employment shares with hypothetical levels that are based on the national averages for these factors, we can discern the effects of each factor.
For the first several metro areas listed in Table 2, all three factors expand the local opportunity employment share when compared with their hypothetical levels using national averages. For example, Boise’s actual opportunity employment share is nearly 4 percentage points higher than its hypothetical value based on national averages, and this difference is largely attributable to its lower cost of living. For Seattle, Los Angeles, and San Francisco, all three factors have a net negative effect on opportunity employment levels; the higher cost of living in these metro areas, as well as in Anchorage and Honolulu, has the greatest limiting effect on opportunity employment in these regions.
Table 2
Effect on Opportunity Employment Share (expressed in percentage points)
| Metro Area | Occupational Mix | Employers’ Educational Expectations | Cost of Living | Total |
|---|---|---|---|---|
| Boise City, ID | +0.3 | +1.4 | +2.2 | +3.9 |
| Provo-Orem, UT | +0.3 | +1.4 | +1.3 | +3.0 |
| Phoenix-Mesa-Scottsdale, AZ | +0.5 | +0.8 | +1.2 | +2.5 |
| Salt Lake City, UT | +0.7 | +1.0 | 0.0 | +1.7 |
| Stockton-Lodi, CA | -0.3 | +1.6 | +0.3 | +1.7 |
| Anchorage, AK | +2.9 | +6.2 | -11.9 | -2.8 |
| Urban Honolulu, HI | -0.3 | +2.2 | -10.7 | -8.8 |
| Seattle-Tacoma-Bellevue, WA | -1.5 | -0.9 | -6.9 | -9.3 |
| Los Angeles-Long Beach-Anaheim, CA | -1.9 | -1.2 | -7.2 | -10.4 |
| San Francisco-Oakland-Hayward, CA | -2.7 | -3.5 | -10.2 | -16.4 |
How can opportunity employment be expanded locally?
A regional economy’s level of opportunity employment is influenced by the types of jobs available, the level of education that employers seek when filling job openings, and the relationship between wages and costs. The multifaceted nature of this issue means local opportunity employment could be expanded through any number of approaches, such as:
- Economic development strategies that prioritize industries characterized by high levels of opportunity employment.
- A reconsideration by employers of their hiring requirements and a commitment to objectively assessing the skills of workers from a variety of educational backgrounds.
- An expansion of both private sector and public sector programs for postsecondary skills development.
- Efforts to better align regional wages and costs, possibly through modest wage increases for lower-wage workers or through efforts to expand the supply of affordable housing.
For more information on these metro areas and 121 of the largest metros in the U.S., read “Opportunity Occupations Revisited: Exploring Employment for Sub-Baccalaureate Workers Across Metro Areas and Over Time.” You can also explore fact sheets describing the 10 largest opportunity occupations in each of the 121 metro areas analyzed.
1. See Unemployment rates and earnings by educational attainment from the Bureau of Labor Statistics.
2. David H. Autor, Lawrence F. Katz, and Melissa S. Kearney, “The Polarization of the U.S. Labor Market.” American Economic Review, 96:2 (2006), pp. 189–94.
The views expressed here do not necessarily reflect the views of the management of the Federal Reserve Bank of San Francisco or of the Board of Governors of the Federal Reserve System.