


Keeping a stable and moderate level of inflation is important for a healthy economy. Policymakers and economists therefore need to understand not only how overall inflation is evolving, but what is driving it. Knowing why inflation changes in any given month requires looking beyond the headline number.
Along these lines, the San Francsico Fed releases a number of indicators that help disentangle the key drivers of personal consumption expenditures (PCE) inflation each month, including supply and demand factors and cyclical and acyclical components.
To help further explore these drivers, we have launched a new data page, called PCE Inflation Contributions from Goods and Services. This page breaks down each inflation reading into the different groups of goods and services that contribute to it.
This analysis allows us to see, for example, how much of inflation is coming from key categories of consumer spending, such as housing, food, and energy. Figure 1 shows that food and energy (light blue bars) and core goods (yellow bars), such as cars and furniture, contributed a significant amount to inflation in the summer of 2022.
Figure 1
Contributions to 12-month headline PCE inflation
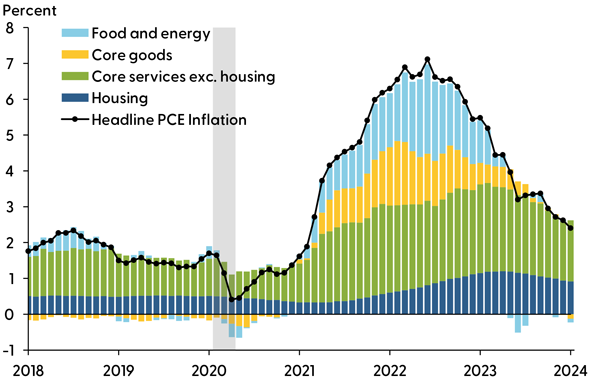
Source: Bureau of Economic Analysis and authors’ calculations.
In contrast, the latest inflation reading from January 2024 shows that the total contribution of these categories to the 12-month, or year-over-year, change in inflation is close to zero. This means that current inflation is being driven almost entirely by services such as health care, transportation, accommodations, and housing rents.
In addition to the current data charts available on the new page, PCE Inflation Contributions from Goods and Services provides historical inflation breakdowns in a downloadable data file, giving users the ability to analyze key inflation drivers over time. It also breaks the larger categories down into more detailed components.
For example, Figure 2 uses historical data to show how non-housing services inflation, sometimes referred to as supercore inflation, and its subcomponents evolved over the Global Financial Crisis (GFC) starting in 2007. Financial services inflation (green bars) declined substantially in late 2008, helping to pull supercore inflation (black line) down to zero by mid-2009. Financial services inflation then recovered in 2010, pushing supercore inflation closer to levels observed before the crisis began.
Figure 2
Contributions to 12-month supercore services PCE inflation
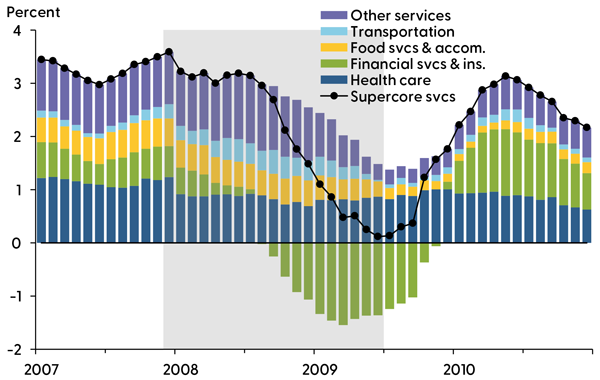
Note: Gray bar indicates NBER recession dates. Supercore services refer to all services excluding energy and housing services.
Source: Bureau of Economic Analysis and authors’ calculations.
In recent months, although supercore inflation has moderated significantly, it remains well above its post-GFC and pre-pandemic levels. Health-care services and food services and accommodations are currently the largest contributors to inflation in this category.
The new Data and Indicators page will be updated monthly shortly following the PCE data release, which is part of the Personal Income and Outlays Release of the Bureau of Economic Analysis.
The views expressed here do not necessarily reflect the views of the management of the Federal Reserve Bank of San Francisco or of the Board of Governors of the Federal Reserve System.