

An unsettled labor market is usually an indication of a troubled economy. In fact, a rapidly increasing unemployment rate characterizes the start of recessions. Therefore, a timely and accurate assessment of labor market conditions is essential for policymakers and market participants.
Our new weekly Labor Market Stress Indicator tracks state-level labor market developments to better understand in real time what these data can tell us about the U.S. economy.
Tracking state-level labor market stress
In a recent FRBSF Economic Letter, “Tracking Labor Market Stress,” we introduced an indicator that uses unemployment claims data to estimate state-level unemployment rates going back to 1948. Based on these estimates, the indicator counted the number of states experiencing accelerating unemployment—defined as a state’s unemployment rate increasing at least 0.5 percentage point above its previous 12-month low.
Our approach is similar to the Sahm rule threshold (Sahm 2019) that is commonly applied to the national unemployment rate. We called our measure the Labor Market Stress Indicator (LMSI). In addition to providing a monthly read on labor market conditions, the LMSI also tracks recession periods as dated by the National Bureau of Economic Research (NBER).
Increasing LMSI frequency with weekly data
State-level unemployment claims data have been made available at a weekly frequency since 1987. Therefore, we based our new SF Fed data page on a weekly version of our LMSI.
Adjusting our methodology from monthly to weekly data requires a slightly different approach. We construct the ratio of initial and continued weekly unemployment claims over a state’s approximate labor force. We measure this as the sum of initial and continuing weekly unemployment claims plus the most recent monthly nonfarm payrolls. This method approximates the formal state labor force data—the sum of employed and unemployed workers—which are released with about a two-month delay.
Our weekly claims measure of a state’s unemployment rate is highly correlated with the official unemployment rate version. To generate an indicator based on the same Sahm rule used in the LMSI, we adjusted the weekly indicator threshold, taking the 0.5 percentage point change over the minimum from the previous 12 months multiplied by the ratio of the national unemployment claims rate to the actual national unemployment rate. This adjustment results in a new threshold value close to 0.2.
The weekly LMSI shares many of the same properties as our original LMSI but is available more frequently, albeit for a much shorter sample. Like the monthly version, it provides a timely measure of labor market stress and also tracks NBER recessions quite well.
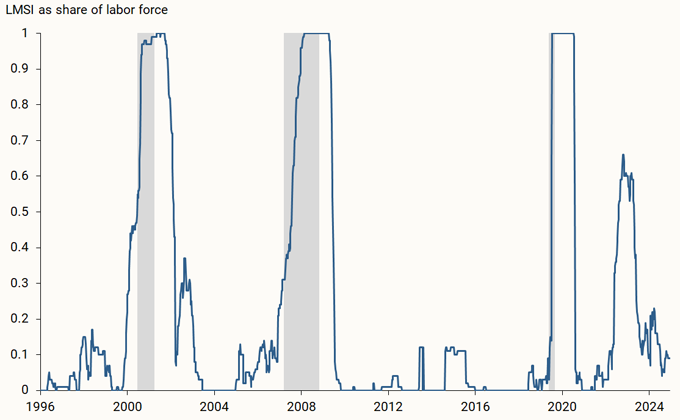
Based on the weekly LMSI, we can also calculate the share of the labor force in states with accelerating unemployment, just as we did when constructing the monthly series. In addition to showcasing the importance of adjusting for differences in populations across states, the labor force share also does a good job at tracking NBER recessions, as shown in Figure 1.
Figure 1
Share of the labor force in states with accelerating unemployment
An economic health status check from weekly data
Where do we stand today? Recent data on how quickly unemployed individuals find a job and how long people remain unemployed indicate that the labor market has recently softened (see Avaradi et al. 2025).
In previous episodes, a rapid deterioration in these two variables has often preceded the onset of a recession. As of data from September 13, our weekly LMSI shows that seven states are currently experiencing accelerating unemployment. However, these include less populous states that represent only about 9% of the national labor force. Even though these readings appear somewhat elevated, the measure generally indicates that the labor market remains stable.
Of course, history teaches us that labor market conditions can change quickly. Our weekly updates give policymakers, analysts and the public another tool to help monitor those changes in real time and better understand the labor market conditions as they evolve.
References
Avaradi, Greeshma, Marianna Kudlyak, Brandon Miskanic, and David Wiczer. 2025. “Assessing the Recent Rise in Unemployment.” FRBSF Economic Letter 2025-09 (April 14).
Garimella, Rohit, Òscar Jordà, and Sanjay Singh. 2025. “Tracking Labor Market Stress.” FRBSF Economic Letter 2025-19 (August 18).
Sahm, Claudia. 2019. “Direct Stimulus Payments to Individuals.” Chapter 3 in Recession Ready: Fiscal Policies to Stabilize the American Economy, eds. Heather Boushey, Ryan Nunn, and Jay Shambaugh. Washington, DC: The Hamilton Project and the Washington Center on Equitable Growth, pp. 67–92.
Related:

The views expressed here do not necessarily reflect the views of the management of the Federal Reserve Bank of San Francisco or of the Board of Governors of the Federal Reserve System.