


Payroll job growth has slowed significantly in the past year. Slower job growth is typically associated with rising unemployment, yet the unemployment rate has barely budged, edging up from 4.2% in August 2024 to 4.3% in August of this year. This has led policymakers to conjecture that labor supply has slowed at the same pace as labor demand (Jefferson 2025, Powell 2025).
In this SF Fed Blog, we document that growth in the labor supply has indeed declined in tandem with the slowdown in payroll growth. This finding relies on appropriate adjustments to the calculation of the labor force. Specifically, we align the counts of those in the labor force who are employed with the measurement of payroll jobs to account for some differences in definitions, incorporate improved population estimates, and remove monthly fluctuations from underlying trends.
The balanced growth slowdown
The green bars in Figure 1 show average monthly changes in nonfarm payroll employment estimates from the U.S. Bureau of Labor Statistics’ (BLS) Current Employment Statistics (CES) data over six-month periods from the first half (H1) of 2023 to the first half of 2025. This aggregation helps focus on overall trends rather than month-to-month fluctuations. The series incorporates recently released preliminary revisions, explained in more detail below.
Figure 1.
Adjusted labor force and total nonfarm employment,
average monthly change
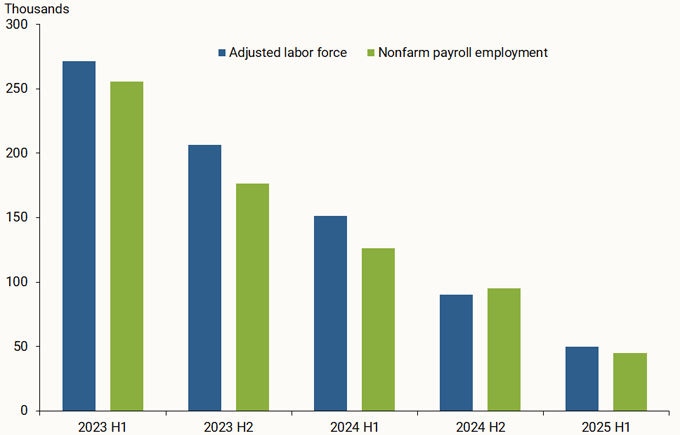
Source: U.S. Bureau of Labor Statistics and authors’ calculations.
The blue bars show corresponding average monthly growth of labor force estimates from the BLS’s Current Population Survey (CPS), with three critical adjustments to the official numbers: employment concept, population weights, and underlying trends.
The figure demonstrates that both labor demand, as captured by payroll employment, and labor supply, as captured by the adjusted labor force, have slowed in tandem, from around 260,000 per month in the first half of 2023 to around 50,000 per month in the first half of 2025. This balanced slowdown has held the unemployment rate largely steady. However, the balanced slowdown is not evident in the unadjusted series.
Adjusting the data is crucial for an apples-to-apples comparison
The payroll and labor force growth data series, as published, are not directly comparable to each other. This can create a puzzle in direct comparisons, as shown in Figure 2: By contrast with Figure 1, labor supply and demand don’t appear to have slowed in tandem. Unadjusted payroll growth outpaced labor force growth in 2024, which should have led to a notable decline in the unemployment rate. Then in 2025, the unadjusted numbers depict labor force growth outpacing payroll growth, which normally would have caused the unemployment rate to rise. Instead, the unemployment rate rose in the first part of 2024 and then remained in a narrow band between 4.1 and 4.2%.
Figure 2.
Unadjusted labor force and total nonfarm payroll employment,
average monthly change
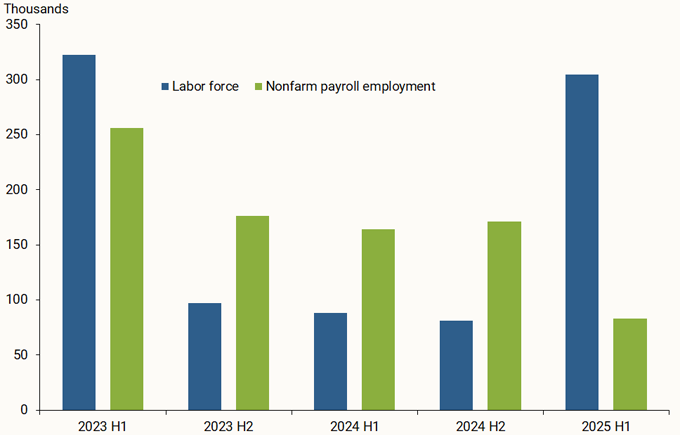
Source: U.S. Bureau of Labor Statistics and authors’ calculations.
There are several sources for the differences shown between the numbers displayed in Figures 1 and 2. Starting with payroll employment, the official data undergo a series of revisions following the first release. Most notable is an annual process that benchmarks the level of total nonfarm payroll jobs for March to the level from counting the near universe of jobs reported to the BLS through the Quarterly Census of Employment and Wages. However, the published data series in Figure 2 do not yet reflect this. We adjust the data in Figure 1 to incorporate the preliminary 2025 benchmark released in September this year, which suggests there were 911,000 fewer jobs in March 2025 than in the initial assessment. We follow the BLS methodology by evenly applying the benchmark revision from April 2024 to March 2025 and thereafter using current estimates of monthly changes. Incorporating the preliminary benchmark adjusts employment growth down from April 2024 through March 2025, showing the slowdown more clearly than without the adjustment.
For the labor force, we make several adjustments. First, we account for differences in the definitions for what counts as a single job in the CES and the CPS that apply to the labor force as well. The BLS provides guidance on adjustments, and following this guidance allows for a more direct comparison. Briefly, employment in the CES does not include armed forces, agricultural workers, or the self-employed, so we remove these groups from our labor force measure. Also, the CES counts jobs, not individuals as the CPS does. Thus, our adjusted labor force data series double-counts anyone in the labor force who holds multiple jobs. Three additional groups of individuals that are not included in CES employment data are very small, so for simplicity we do not remove them. These are unpaid family workers, workers in private households, and non-agricultural wage and salary workers on unpaid leave.
Second, we use new harmonized population sample weights produced by researchers at the Board of Governors of the Federal Reserve System (Coglianese, Murray, and Nekarda 2025). Population counts are updated roughly each year, but the CPS weights are not retroactively changed in the officially released microdata that are used to calculate the size of the labor force. This can lead to large swings in labor force counts that could result in misleading growth measures that span two years, as shown by the blue bars for 2023 and the first half of 2025 in Figure 2.
Finally, we apply a common smoothing procedure, called a Hodrick-Prescott (HP) filter, that extracts underlying trends in a time series. Measurements of the labor force fluctuate from month to month, and smoothing over these monthly fluctuations helps capture underlying trends.
All of these adjustments to the labor force make a difference. Using historically consistent weights and an HP filter are particularly important through 2024. In 2025, harmonizing the definitions for employment and the labor force makes the most notable difference, particularly adjusting for workers who hold multiple jobs, as this group has been growing recently.
Conclusion
The bottom line is that it is hard to assess whether labor supply and demand growth have eased similarly when the data are not comparable. Making the proper adjustments to measure payroll employment and labor force data on the same basis shows that labor demand and supply have slowed in tandem.
References
Coglianese, John, Seth Murray, and Christopher J. Nekarda. 2025. “Harmonized Population and Labor Force Statistics.” Federal Reserve Board of Governors, Finance and Economics Discussion Series 2025-057.
Jefferson, Philip N. 2025. “Economic Outlook and the Fed’s Monetary Policy Framework.” Speech delivered at the Drexel Economic Forum, Drexel University LeBow College of Business, Philadelphia, PA, October 3.
Powell, Jerome H. 2025. “Transcript of Chair Powell’s Press Conference.” Federal Reserve Board of Governors, Washington, DC, September 17.
Related:


The views expressed here do not necessarily reflect the views of the management of the Federal Reserve Bank of San Francisco or of the Board of Governors of the Federal Reserve System.