Climate-Related Risks Faced by Low- and Moderate-Income Communities and Communities of Color: Survey Results

Authors

Elizabeth Mattiuzzi and Eileen Hodge, Federal Reserve Bank of San Francisco

Download PDF
(2 MB)

December 9, 2021

Download PDF (pdf, 2.43 mb)

Executive Summary

The impacts of climate change are creating new risks and exacerbating existing risks for individuals, communities, and the economy. Climate shocks and stresses disproportionately impact groups that have traditionally faced higher barriers to participating in the economy than the general population, including low-income communities, communities of color, and Tribal populations. Our team fielded a survey targeting professionals in the western United States from a broad range of sectors whose work on community development‒related issues impacts the personal and economic well-being of low-income communities and communities of color. Over 250 respondents shared their perceptions of how climate-related risks may be affecting the communities they serve and their organizations’ work.

Key Takeaways

  • Most respondents perceive climate change‒related risk as already impacting the communities they serve.
  • General awareness of climate-related risk is high among respondents; however, resources and capacity are limited, and collaboration could be increased.
  • Respondents believe that the communities they serve and their organizations are generally not well prepared for climate-related risk.
  • Lack of savings, lack of transportation options, lack of housing options in resilient areas, the threat of housing displacement, and worker health rank high among respondents’ perceived contributors to climate-related risk for the communities they serve.
  • Lack of funding impedes respondents’ work to improve resilience for families and communities.
  • Notably, respondents perceive day-to-day economic survival as taking precedence for individuals and families over concerns about climate risk and resilience.

Summary of Results

  • The vast majority of respondents (90%) report that climate impacts are already affecting the population(s) they serve.
  • Most respondents (81%) feel that the communities they serve are not well prepared for the impacts of climate change.
  • About half (51%) of those surveyed feel that their organization is not well prepared to address the impacts of climate change on their work.
  • Over one-third (39%) of respondents state that their organization is working to address climate-related risks and vulnerabilities in the communities they serve.
  • A large majority (83%) of respondents report that they understand climate risks and vulnerabilities experienced by the communities they serve.
  • Over two-thirds (72%) of respondents view a lack of housing options in resilient areas as a large contributor to climate-related risk for the communities they serve.
  • Over half (62%) of respondents see a lack of savings as a large contributor to climate-related risk for the communities they serve.
  • Roughly half (52%) of respondents view a lack of transportation options, especially in the event of an emergency, as a large contributor to climate-related risk for the communities they serve.
  • Roughly half (52%) of respondents view the high cost of utilities as a large contributor to climate-related risk for the communities they serve.
  • Roughly half (52%) of respondents see the ongoing risk of housing displacement as greatly exacerbating climate-related risk for the communities they serve.
  • Roughly half (51%) of respondents believe that a lack of resilience in the existing housing stock contributes to climate risk by a large amount in the communities they serve.
  • Roughly three-quarters (76%) of respondents view climate shocks and stresses as contributing a large amount to a reduced availability of housing in local economies.
  • Over half (55%) of respondents see climate shocks and stresses as contributing a large amount to negative impacts on worker health.
  • Over half (61%) of respondents believe that funding constraints limit climate resilience efforts by a large amount in the communities they serve.
  • Roughly half (53%) of those surveyed believe that individuals’ more immediate concerns, notably their day-to-day economic survival, greatly impede climate resilience and efforts to improve it.

Introduction

The impacts of climate change are creating new risks and exacerbating existing risks for individuals, communities, and the economy.i These impacts include increases in the frequency and severity of weather-related events, such as wildfires, floods, droughts, and extreme temperatures. These events—from deadly heat waves to everyday strains on energy bills and access to clean water—have direct and indirect impacts on families, infrastructure, and the health of the economy.

Climate shocks and stresses disproportionately impact groups that have traditionally faced higher barriers to participating in the economy than the general population, including low- and moderate-income communities, communities of color, and Tribal populations. For example, communities that already face higher exposure to pollution are less resilient to the health impacts of climate-related events.ii Children and older adults also face higher vulnerability to the health impacts of climate change than the general population.iii Scientists expect the greatest economic impacts of climate change to be felt by the poorest counties in the United States.iv There is a large overlap between low-income census tracts and counties that have had declared disasters in the past few decades.v In neighborhoods across the country, historic disinvestment in infrastructure in low-income communities and communities of color exacerbates climate risks.vi Greater exposure to climate risks affects the economic stability of these communities and the ability of individuals to fully participate in their local and regional economy, which affects the health of the overall economy.vii

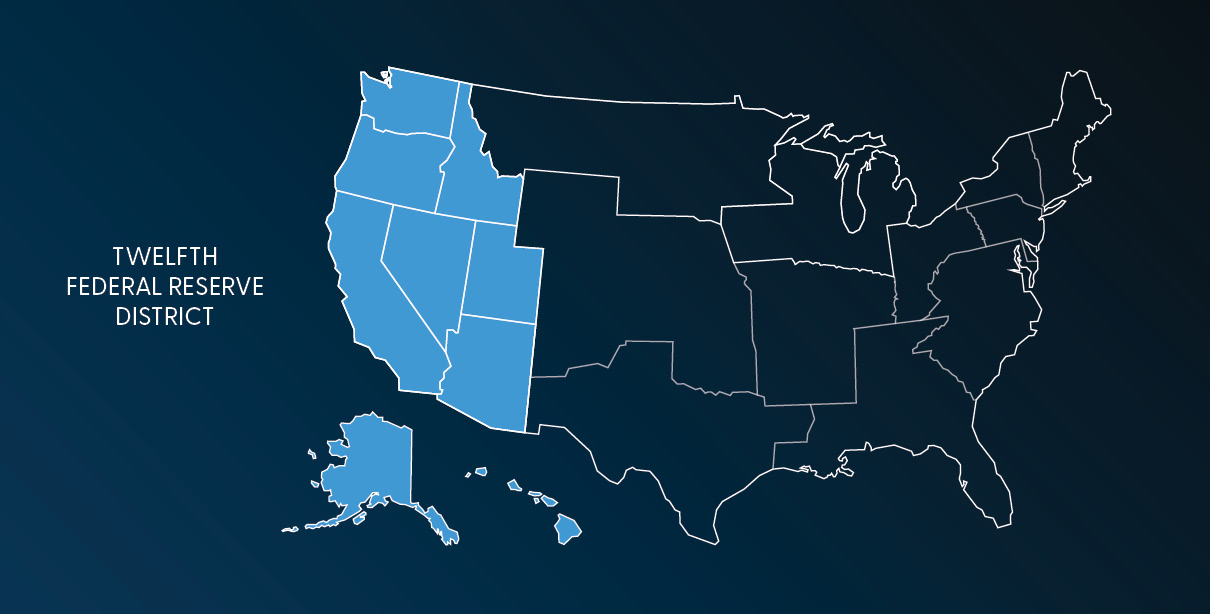
Our team surveyed professionals who work with low-income communities and communities of color in the geography that the San Francisco Fed serves—the western United States and Pacific territories (Alaska, Arizona, California, Hawaii, Idaho, Nevada, Oregon, Utah, Washington, American Samoa, Guam, and the Northern Mariana Islands)—to understand their perceptions of how climate-related risks may be impacting communities and their work in this area. Survey outreach targeted people and organizations in different sectors, such as finance, government, philanthropy, and nonprofits, whose work affects the personal and economic well-being of low- and moderate-income communities and communities of color. The Federal Reserve supports efforts in these sectors to understand and help reduce barriers to employment and economic participation through research and engagement.

Survey Responses, Methods, and Questions

We fielded our survey between June and August 2021 using an online survey tool.viii We received survey responses from 253 individuals. The number of responses to individual questions and the phrasing of questions accompany each figure in the report. Our outreach consisted of emails to our team’s contacts, social media posts, and a blog post on our website.ix In our outreach, we requested that our contacts share the survey with their networks.x We endeavored to reach respondents across the nine western states and Pacific territories that the Federal Reserve Bank of San Francisco serves, and we report the share of respondents whose organizations work in each state or territory in the next section. We also sought to reach people who work on a variety of community development‒related issues at a variety of organization types. Where we thought that our contact list skewed toward a particular geography or sector, we did additional outreach. Bias in the sample could also arise from the fact that the people who chose to respond to the survey are those who already had an interest in climate-related issues. To help address this, we tailored communications to reach respondents who do not work at organizations whose primary mission focuses on climate change.

In this brief, we share results on several question areas, followed by a discussion about the implications for community development policy and practice. First, we asked about the geographic coverage, sector, and mission of the respondents’ organization. Next, we asked if and when respondents expect climate impacts to affect the populations they serve. We then asked respondents to assess their individual, organizational, and community-level engagement with climate-related risk. We asked respondents to assess factors that may be making climate risk worse for individuals and households, and whether/how climate shocks and stresses are impacting local economies. We also asked respondents to evaluate factors that may present barriers to making communities more resilient. Additionally, we asked respondents to share their perception of what types of organizations are working to reduce climate risk in the communities they serve. For each question, we gave respondents a set of options, based on our research, and space to write in other options.

Results

Respondent Organization Geography, Sector, and Mission

Figure 1. Percentage (and Number) of Respondents by State or Territory
State Percent/Number
Alaska 6% (15)
Arizona 18% (45)
California 54% (136)
Hawaii 7% (18)
Idaho 8% (21)
Nevada 10% (26)
Oregon 16% (40)
Utah 8% (19)
Washington 16% (41)
America Samoa 3% (7)
Guam 4% (9)
Northern Mariana Islands 2% (6)

N=252
Note: Respondents could choose more than one option. “What state(s) or territories does your organization primarily work in? Select all that apply.”


We received survey responses from organizations that work in all of the states and territories in the Twelfth Federal Reserve District served by the Federal Reserve Bank of San Francisco. Some respondents selected multiple geographies because their organization operates in multiple states.

Over half (54%) of respondents report that their organization operates in California; 18% work in Arizona; 16% work in Oregon; 16% work in Washington State; 10% work in Nevada; 8% work in Idaho; 8% work in Utah; 7% work in Hawaii; 6% work in Alaska. Four percent of respondents’ organizations work in Guam, 3% in American Samoa, and 2% in the Northern Mariana Islands.

Figure 2. Respondent Organization Type
State Percent/Number
Community-Based Organization/Nonprofit 31%
Local Goverment (e.g., City/County) 18%
Nonprofit Financial Institution 13%
Statewide/National Nonprofit 11%
For-Profit Financial Institution 7%
State Government 4%
Philanthropy/Foundation 4%
University 4%
Independent Consulting/TA/Research 3%
Business 2%
Federal Government 2%
Regional Government (e.g. MPO/COG) 2%
Tribal 1%

N=252
Note: Categories are exclusive. “What type of organization do you work for? Please select one.”


The largest share of respondent organizations are community-based organizations or nonprofits (31%); an additional 11% of respondent organizations are nonprofits with a state- or national-level scope.

Figure 3. Respondent Organization Primary Geographic Focus
Geographic Focus Percent/Number
City 20%
County 25%
Region 27%
Rural 3%
Tribal 5%
State 23%
National 1%

N=251
Note: Some respondents noted more than one geographic focus (e.g., rural and Tribal). “Are there particular cities, counties, Tribal areas, or metropolitan region(s) that your organization focuses on? Please list.”


Respondents could list what places their organization focuses its work. We categorized their write-in responses into geographic categories. Five percent of respondents note that their organization works in Tribal areas, and 3% specifically focus on rural areas. Many respondents comment that they operate in multiple metropolitan regions. Twenty-seven percent of respondents note that their organization works in one or more urban or rural regions or multi-county subregions. A quarter of respondents’ organizations (25%) focus primarily on one county, and 20% focus primarily on one or more specific cities.

Figure 4. Respondent Organization Primary Focus Area(s)
State Percent/Number
Housing 54%
Economic/Workforce development 42%
Social services/Homeless services 33%
Health/Mental health 32%
Climate adaptation/Resilience 30%
Small business development 28%
Environmental Justice 23%
Consumer finance/Financial inclusion 21%
Transportation 16%
Early childhood/Youth development/Education 7%

N=252
Note: Survey respondents could choose more than one response. “What issue(s) does your organization primarily work on? Please select all that apply.”


Organizations with many different policy and practice specializations engage in work that impacts the well-being of low-income communities and communities of color. A large share of respondents (54%) count housing issues as one of the primary focus areas of their organization’s work. Many respondents note more than one focus area, reflecting the fact that organizations that engage in community development‒related work often have multiple primary missions. The responses reflect the traditional focus of community development on housing, economic/workforce development (42%), and social services (33%). Thirty percent of respondent organizations focus on climate adaptation or resilience, and 23% focus on environmental justice (EJ). Our survey also reached respondents who focus on health (32%), small business (28%), and financial inclusion (21%).

Although we expected those who work on climate or EJ to respond to the survey, two-thirds of respondents (66%) did not select either climate or EJ as one of the primary focus areas of their work. Our team focused its outreach efforts on connecting with a broad range of respondents who work on community development issues, not only those who primarily focus on climate adaptation/resilience and EJ and might have a predisposed interest in our survey.

We categorized additional write-in responses for “primary organization focus” that each totaled 5% or fewer respondents, including racial and economic equity, general community development, water or sanitation management, environmental sustainability or environmental social governance (ESG), lending and finance, and disaster preparation/response. Write-in focus areas of 1% or less of respondents included fire management, renewable energy and energy efficiency, forestry and wildlife management, arts and culture, senior care and programming, urban or rural agriculture and food systems, and parks and urban green space.

Perception of Timeline for Community Climate Risk

Figure 5.
“When do you think climate impacts will start affecting the communities you serve?”
Year Progress
Climate impacts are already affecting the population(s) we serve 90%
In the near term (0-5 years) 4%
We do not forsee climate impacts affecting the population(s) we serve 4%
In the long term (6+ years) 2%

N=250


The vast majority of respondents view climate impacts as a current risk to low-income communities and communities of color; 90% of respondents say that “climate impacts are already affecting the population(s) we serve.” Four percent expect impacts in the next five years and 2% expect impacts over a longer time frame, while 4% of respondents do not expect the impacts of climate change to affect the populations they serve. Two respondents’ (0.8%) comments reflect that they do not believe that climate change is occurring.

Understanding of and Preparation for Climate Risk by Respondent and Organization

Figure 6
We asked respondents to select their level of agreement with the following statements:
Strongly agree Somewhat agree Neither agree nor disagree Somewhat disagree Strongly disagree
The communities my organization serves are well prepared for the impacts of climate change. 1% 4% 14% 34% 47%
My organization is well prepared to address the impacts of climate-related risk on our work 6% 15% 29% 26% 25%
My organization is working to address climate-related risks and vulnerabilities in low-income communities and communities of color 15% 24% 22% 17% 21%
I understand how climate-related risk impacts my organization’s work 24% 34% 24% 12% 6%
I understand the climate-related risks and vulnerabilities experienced by the communities my organization serves 39% 44% 10% 4% 3%

N=251


A very small share of respondents (5%) believe that the communities they serve are prepared for climate risks. One percent of respondents strongly agree that their communities are well prepared for climate impacts, and 4% somewhat agree. Most respondents (81%) feel that their communities are not well prepared for the impacts of climate change. Forty-seven percent strongly disagree and 34% somewhat disagree with the statement that “the communities my organization serves are well prepared for the impacts of climate change.”

About half (51%) of respondents feel that their organization is not well prepared to address the impacts of climate change on their work. Twenty-five percent of respondents strongly disagree and 26% somewhat disagree with the statement that “my organization is well prepared to address the impacts of climate-related risk on our work.” Conversely, 21% of respondents agree that their organization is prepared for how climate risk will impact their work, but only 6% of respondents agree strongly.

Over a third (39%) of respondents state that their organization is working to address climate-related risks and vulnerabilities in the communities they serve. Considering again that only 30% of respondents indicate that climate adaptation/resilience is central to their organization’s mission, this suggests that some non-climate-focused organizations are working to reduce climate risks in the communities they serve. A higher number of respondents (58%) report that they understand how climate-related risk impacts their organization’s work. This 19-percentage-point gap between those who perceive an impact of climate risk on their work and those whose organizations are actively working on climate adaptation/resilience suggests that other limitations may be at play.

Encouragingly, a large majority (83%) of respondents report that they “have an understanding of climate risks and vulnerabilities experienced by the communities” they serve. Thirty-nine percent of respondents strongly agree with this statement. Forty-four percent somewhat agree with this statement, suggesting that a broad swath of respondents is still somewhat unsure of how climate-related risks impact their communities.

Perceived Contributors to Climate-Related Risk for Individuals

Figure 7
“How much do each of the following factors contribute to climate-related risk for individuals in the communities you serve?”
Large amount Medium amount Small amount Not at all
Lack of savings (e.g., for an emergency) 62% 27% 9% 3%
Lack of transportation options in the event of an emergency 52% 34% 12% 3%
High cost of utilities 52% 29% 14% 5%
Potential exposure to pollution in the event of a disaster 47% 30% 18% 5%
Hard infrastructure not resilient (e.g. electrical grid, drainage, street trees, evacuation routes…) 44% 35% 18% 4%
Current/past exposure to pollution 42% 32% 20% 7%
Lack of social capital in the event of an emergency (e.g. connections to neighbors…) 28% 37% 28% 6%

N=250


Respondents cite a lack of savings, such as for an emergency, as the largest contributing factor to climate-related risk for the communities they serve (among non-housing-related factors). Sixty-two percent of respondents see lack of savings as a large contributor to climate risk for the communities they serve, and 27% see it as a moderate contributor. Close to half of Americans would have to borrow or sell something to manage an unexpected $400 expense, such as from property damage, evacuation costs, or loss of income during a disaster.xi Households with more savings and less debt are better able to withstand a financial shock, such as expenses incurred during a disaster.xii

Roughly half (52%) of respondents believe that a lack of transportation options, especially in the event of an emergency, are a large contributor to climate-related risk for the communities they serve. An index developed by the Centers for Disease Control considers lack of transportation access a social vulnerability factor; access to public transportation or a private vehicle comes into play if households need to evacuate in the event of a fire or flood or travel to a cooling center or coastal areas in the event of a heat wave.xiii

Roughly half (52%) of respondents view the high cost of utilities as a large contributor to climate risk for the communities they serve. For low-income households, utility costs can present a tradeoff with spending on other necessities, such as food and medication. The constrained choice to not heat or cool the home can pose health risks for families on a regular basis and safety risks during an extreme weather event.xiv High-heat days also affect school performance, particularly in schools in disadvantaged neighborhoods in warm climates that lack air conditioning.xv

Pollution exposure in the event of a disaster ranked high on respondent concerns about climate impacts on the communities they serve. Just under half (47%) of respondents see potential exposure to pollution in the event of a disaster as a large contributor to climate risk for the communities they serve. Smoke exposure during increasingly frequent wildfires poses health risks for workers in construction, agriculture, and recreation, as well as firefighters.xvi

Forty-four percent of respondents believe that deficiencies in local infrastructure are a large contributor to climate-related risk for the communities they serve. Forty-two percent view existing exposure to pollution as exacerbating climate risk by a large amount—for example, by contributing to underlying health conditions among vulnerable populations. Twenty-eight percent of respondents see a lack of social capital as a large contributor to climate-related risk for the communities they serve.

Comments on Factors That Exacerbate Climate-Related Risks

Respondent comments provide additional detail on factors that they believe exacerbate climate risks for the communities they serve.

Information barriers

Information barriers that respondents see as contributing to climate risk for the communities they serve include a lack of access to the internet, language barriers, a general lack of outreach about disaster preparation, and challenges accessing information during a disaster.

Financial barriers

Respondents note a variety of financial barriers to climate resilience for the communities they serve. One respondent notes that much of the population with which their organization works are “low-wage earners, [and] with the costs of child care, transportation, housing, etc., [it] make[s] it nearly impossible to prepare for climate change or make decisions that make their communities more resilient.”

Respondents also note interruption to livelihoods as a financial risk factor for communities facing climate impacts. One respondent comments, “We represent people who do hard physical labor outside, where wildfire smoke caused by climate change creates both health risks during increasingly common smoke events, and high-heat days also create conditions that limit work…and can interfere with their ability to earn a living” in agriculture or recreation.

One size does not fit all

Several respondents point out the need for locally tailored solutions. For example, one respondent in Alaska notes that “entire communities need to be relocated, which translates as no investment in the existing communities. The economies are primarily subsistence, and there is a lack of water/sewer, road, and other ‘usual’ infrastructure.”

Social capital

Several respondents note in comments that social capital, or mutually supportive ties between community members, plays an important role in reducing climate risk for individuals. For example, one respondent comments that most of the people whose deaths were attributed to the heat wave in the Portland metro area in July 2021 were socially isolated, a point that is confirmed by the official statistics.xvii

One respondent sounds a hopeful note about social capital, commenting, “The pandemic has strained existing networks, but it has also strengthened them—which gives me some hope that with focused, intentional, pro-equity actions, we could help folks at greatest risk be more resilient in the face of these changes/challenges.”

Housing-Related Contributors to Climate Risk for Individuals

Figure 8
Breakout of housing-related factors in “How much do each of the following factors contribute to climate-related risk for individuals in the communities you serve?”
Large amount Medium amount Small amount Not at all
Lack of housing options in resilient areas 72% 20% 6% 2%
Currently at risk of housing displacement 52% 32% 12% 4%
Existing housing not resilient (e.g. lacks weatherization, fire hardening, AC, air filters…) 51% 36% 11% 2%
Lack of landlord interest in improving housing resilience 43% 35% 15% 7%

N=250


Respondents view a lack of supply of affordable places to live in cities/regions that are more resilient as a top concern. Seventy-two percent of respondents cite a lack of housing options in resilient areas as a large risk factor for the communities they serve—the highest of any risk factor, both housing- and non-housing-related. For many years, constrained housing supply in job centers, particularly in coastal areas in the western United States has put development pressure on areas with higher fire and flood risks.xviii, xix In states such as Idaho, a greater percentage of the housing stock is at risk from wildfires, making potential recovery times from a major fire longer than in more urbanized states.xx

Roughly half (52%) of respondents see the ongoing risk of housing displacement as exacerbating climate risk by a large amount for the communities they serve. Like financial instability, housing instability makes it more challenging for people to face additional costs and disruption from climate shocks and stresses.

Roughly half (51%) of respondents believe that a lack of resilience in the existing housing stock (such as weatherization, energy efficiency, renewable energy, fire/flood hardening, air conditioning, etc.) contributes to climate risk a large amount for the communities they serve. This is greater than the 44% who see neighborhood infrastructure (such as street trees, drainage, and evacuation routes) as a large risk factor, indicating that respondents are more focused on people’s homes than the surrounding area. Forty-three percent of respondents viewed landlord interest in improving housing resilience as a large contributor to climate-related risk.

Comments on Housing-Related Factors That Exacerbate Climate-Related Risks

Housing instability and unsheltered populations

Respondent comments reflect the role of housing instability in contributing to climate risk, and vice versa. One respondent comments that “individuals who have low income[s] are at greater risk of displacement in a high-cost housing market, particularly if their financial situation changes and/or if they encounter an emergency. In the event of an emergency/disaster, individuals with low income[s] have limited/lack of savings to be financially resilient, which could lead to displacement and exposure to climate-related risks.” Another respondent comments that in the Phoenix region, extreme heat is particularly dangerous for unsheltered populations.

Housing resilience

Respondents report additional challenges around the lack of resilience in existing housing. One respondent comments that air conditioners, unlike heating, are not required in the Los Angeles region, even with historically warm temperatures and an increasing number of high- or extreme-heat days. Another respondent comments that as housing prices climb in Maricopa County, Arizona, “mobile homes are one of the only affordable housing options in the county, but these homes and parks are particularly risky as it relates to heat exposure, and the low and often fixed incomes of residents make it difficult to manage utility costs or make improvements.”

Perceived Contribution of Climate Shocks and Stresses to Risks for Local Economies

Figure 9
“How concerned are you about climate shocks and stresses contributing to the following risks for local economies in the communities you serve?”
Large amount Medium amount Small amount Not at all
Reduced availability of housing 76% 16% 4% 4%
Health impacts on workers 55% 32% 10% 2%
Reduced employment of small business opportunities 49% 31% 16% 4%
Resident out-migration 28% 29% 30% 13%

N=251


Roughly three quarters (76%) of respondents view climate shocks and stresses as contributing a large amount to reduced availability of housing in local economies. For example, when wildfires destroy homes, there is increased pressure on the remaining housing supply, particularly over the short run and for households that cannot afford to rebuild. Lower-income workers and small business owners can face increased housing costs, as well as loss of income, after a disaster.xxi

Over half (55%) of respondents see climate shocks and stresses as contributing a large amount to impacts on worker health. For example, many agricultural workers in the western United States faced smoke exposure during wildfires in recent years.

Roughly half (49%) of respondents see climate shocks and stresses as contributing a large amount to the risk of reduced employment opportunities or small business opportunities in the communities they serve.

Twenty-eight percent of respondents view resident out-migration as having a large impact on local economies that are impacted by climate shocks and stresses. This likely reflects differences in how climate shocks and stresses affect different regions, as the comments below suggest.

Comments on Contribution of Climate Shocks and Stresses to Risk for Local Economies

Housing affordability

Several respondents comment that loss of housing from wildfires has made it harder for low-income workers to afford to live in their community. One respondent comments that in California and Oregon, “the loss of housing seems to be mostly affordable units like trailers, unpermitted housing, etc. …Rebuilding any housing stock for those populations is extremely slow and burdensome.”

On a similar note, another respondent comments that “fire impacts in Southern Oregon… [are] a perfect storm for those living in the destroyed mobile-home parks. Already COVID-ravaged, now they are living in hotels, garages, cars, etc.”

A respondent who works in rural and Tribal areas across the western United States and Pacific territories comments, “We have directly witnessed the impacts of wildfire on affordable housing availability in areas where the market was already tight.”

Workers and economic activity

A common theme among respondent comments is the lack of other employment options for workers whose jobs may be impacted by extreme heat, wildfire smoke, water shortages, power outages, and other climate-related shocks and stresses. One respondent comments that “job security and economic diversity are major concerns for workers who may be affected by climate shocks and stressors.” Occupations of concern for respondents included tourism, agriculture, and warehouse jobs. Loss of local tax revenue, due to reduced economic activity, is also a concern.

Several respondents note that migrant/seasonal farmworkers, many of whom are Latino or undocumented Latin Americans, face such challenges as language barriers and difficulty accessing disaster relief in the event of climate-related disasters.xxii

Respondents working in many geographies note job losses and precarity in the tourism industry in relation to climate shocks and stresses. Concerns about climate impacts on local tourism economies spanned urban and rural areas, including Washington State (e.g., North Central Washington), Oregon (e.g., Mid‒Willamette Valley), Hawaii, the Northern Mariana Islands, California (e.g., Lake County and Los Angeles), Idaho, and Nevada.

One respondent is hopeful about the potential for climate adaptation/resilience to improve local economies, commenting, “I believe there is significant potential for entrepreneurship and business opportunities related to climate resilience, emergency preparedness and response, and a just transition to a green economy.”

Out-migration and in-migration

Respondent comments are mixed on the likelihood of out-migration’s hurting the local economy. For example, one respondent does not see out-migration as a likely constraint on the local labor supply, noting, “Regarding resident out-migration, I’m less concerned because I think that wealthy households will have the resources to manage growing heat risks, while low- to moderate-income households may be stuck in place.” In contrast, another respondent comments that “the Camp Fire wiped out 90% of the affordable housing in Paradise, CA, which, in turn, caused a great deal of immediate out-migration. Jobs were lost when businesses were either destroyed or now lack adequate population to meet their market requirements. The largest single employer in the town was a hospital, which has decided not to rebuild there, impacting not only job losses, but also needed medical services for area residents, many of whom are seniors.”

Several respondents observe that in-migration, due to climate impacts in other places in the United States and Latin America, is straining the local housing supply.

Perceived Limits on Resilience

Figure 10
“How much do each of the following factors limit climate resilience efforts in the communities you serve?”
Large amount Medium amount Small amount Not at all
Lack of funding for adaptation and resilience 61% 29% 8% 3%
Residents have more immediate concerns 53% 31% 11% 4%
Limited public-sector capacity 48% 35% 12% 5%
Lack of cross-sector coordination 42% 39% 16% 3%
Residents lack awareness of the issue 37% 35% 20% 8%

N=249


We asked survey respondents to assess factors that might be holding back resilience activities in the communities they serve. Lack of funding is the greatest barrier to resilience efforts that respondents perceive. Sixty-one percent of respondents believe that funding constraints contribute a large amount to limiting community climate resilience efforts.

After funding, respondents believe that the second-largest barrier to climate resilience work in the communities they serve is that residents have more immediate concerns. Roughly half (53%) of those surveyed believe that the fact that “residents have more immediate concerns” impedes climate resilience efforts by a large amount. Financial stability and housing stability are possible concerns that community members may be facing that they would need to prioritize over climate resilience per se, although these issues are related to household climate resilience, as discussed previously.

Nearly half (48%) of those surveyed report that constraints around public-sector capacity are a large barrier to climate resilience work, and 42% say that a lack of cross-sector coordination is a large barrier. Much resilience work falls to local government, and many of these jurisdictions lack the resources, staff, or expertise to address climate resilience on top of their other infrastructure and service provision responsibilities.

Lack of resident awareness ranked lowest out of the barriers that respondents see as standing in the way of climate resilience work. However, 37% of respondents believe that awareness among the community members they serve played a large role in impeding climate resilience efforts.

Comments on Barriers to Climate Resilience

Residents have more immediate concerns

Many respondents elaborate in their comments on the idea that the communities they serve face everyday issues related to poverty and economic survival that supersede direct concerns about climate resilience. One respondent notes, “People are trying to get by day-to-day, and many do not have the time or resources to adapt.” Another comments that “when you are in ‘survival mode’… immediate needs—food, clothing, shelter, medical needs—are the first ones taken care of. In most cases, the resources they have is not even enough to take care of these. There are no resources left to deal with climate resiliency factors.” Several respondents note recovery from the COVID-19 pandemic as a primary concern, as well as longer-standing issues around substance abuse, in their communities.

Funding and capacity

Respondent comments suggest that current funding is mismatched, or that there is a lack of capacity to even apply for funding for resilience, or that competition with other geographies is prohibitive. One respondent comments that “the limited capacity of public agencies/CBOs [community-based organizations]…translates to a lack of pursuit of available funds to integrate climate risk generally into their work. Even if technical assistance is granted to engage, there isn’t meaningful involvement from nonprofit developers or public agencies in a way that would build lasting institutional knowledge.” Similarly, another respondent notes that “very small rural communities do not always have the capacity to apply for, access, and deploy [resilience] funding.” One respondent working in Alaska notes that “the cost to relocate is overwhelming… It is hard to know where to start. If you start with housing, what about schools, boat launch, air strip, etc.”

Obstacles exist even where there is available funding. One respondent points out the obstacles of “siloed funding and administrative burdens that come with funding, or funding structures not designed in a way that maximizes CBO/nonprofit capacity.” Similarly, another respondent comments that “small communities who are facing most of the wildfire threats have zero capacity or access to resilience-building resources.”

Cross-sector collaboration

Many respondents see cross-sector collaboration and collaboration among different scales of government as essential to climate resilience work. One comments that “lack of regional coordination is a large concern.” Another reports that their organization is working “to find capacity-building support for collaboration within the nonprofit sector and also to establish effective county/nonprofit collaboration, as well as between businesses and communities, especially any capacity-building that supports wildfire mitigation practices.”

Another respondent notes that collaboration exists but that competition for funding for community resilience work is prohibitive: “We have enormous agency collaboration throughout the Inland So Cal area. We have tons of nonprofits doing excellent work. We have created model programs adopted by other agencies. We’re in the 10th-largest metro area in the U.S., and we’re getting almost no investment or philanthropy.”

A third respondent reflects on obstacles to cross-sector collaboration in pandemic-related funding sources that could provide lessons for future potential resilience programs, commenting that “reimbursements, incentives, the ability to cut through the paperwork—these things need to improve so more financial institutions, like CDFI CUs [community development financial institution credit unions] and LIDs [credit unions with mostly low-income customers], will come to the local government table to help our most vulnerable populations.”

Additional factors limiting climate resilience efforts

Respondent comments suggest additional factors contributing to a lack of preparation for climate-related risk by communities and organizations that serve them, including a lack of data on risks and the costs of action/inaction, outdated local building codes or permitting processes, lack of local leadership around climate risk, and challenges translating research into action.

Perceptions of Involvement Levels of Organization Types in Community Resilience Work

Figure 11
“To your knowledge, how involved are the following types of organizations in efforts to reduce climate-related risk for low-income communities or communities of color in the communities you serve?”
Large amount Medium amount Small amount Not at all
Community-Based Organization/Nonprofit 24% 41% 27% 7%
Statewide/National Nonprofit 11% 39% 38% 13%
Local Government (e.g., City/County) 10% 39% 37% 14%
State Government 10% 36% 35% 19%
University 13% 31% 36% 20%
Philanthropy/Foundation 7% 37% 36% 20%
Federal Government 5% 34% 44% 17%
Regional Government (e.g., MPO/COG) 6% 28% 44% 22%
Nonprofit Financial Institutions 7% 25% 48% 21%
For-Profit Financial Institutions 4% 8% 50% 38%

N=246


Elucidating respondent perceptions of who is involved in community climate resilience work helps shed light on relationships in the field and opportunities for greater collaboration, as well as actual work going on in these areas. Not surprisingly, respondents see local and national nonprofits, who are key actors in community development, as the most involved in efforts to reduce climate-related risk for low-income communities and communities of color in the communities they serve. Sixty-five percent of respondents view community-based organizations/nonprofits and 50% view statewide/national nonprofits as being involved a large or medium amount in efforts to reduce climate risk in low-income communities and communities of color.

Respondents view financial institutions, both nonprofit and for-profit, and philanthropy as having a smaller level of involvement than other institutions, on average, in efforts to reduce climate-related risk for low-income communities and communities of color. Thirty-two percent of respondents see nonprofit financial institutions and 12% see for-profit financial institutions as having a large or medium amount of involvement in efforts to reduce climate-related risk for low-income communities or communities of color. Forty-four percent of respondents see philanthropic organizations or foundations as having a large or medium amount of involvement. This suggests that there is room for greater leadership and/or participation, or better communication about their efforts, in climate risk reduction from these sectors. Furthermore, there could be a geographic mismatch between the climate resilience work that financial institutions and philanthropy are engaging in and those who responded to the survey. This suggests a potential need for a broader reach of resilience-related investment and grantmaking in geographies with vulnerable populations.

Respondents perceive different average levels of involvement from different scales of government. Roughly half (49%) of respondents see local governments, who are on the front lines of climate resilience work, as being involved a large or medium amount in efforts to reduce climate-related risk for low-income communities and communities of color. Forty-six percent see a medium or large amount of state government involvement and 39% see a large or medium amount of federal agency involvement in climate risk reduction efforts in the communities they serve. Regional government or quasi-government agencies—such as those that work on transportation, housing, and economic development (e.g., metropolitan planning organizations, councils of governments, economic development districts)—rate lower, on average, on respondent awareness of their climate resilience work (34% large or medium amount) than other scales of government, suggesting room for more involvement by these institutions in community climate resilience work.

Several respondents note university partnerships on climate resilience data gathering/sharing, but this varies by region based on the footprint of those institutions. Forty-four percent of respondents view universities as having a large or medium level of involvement in efforts to reduce climate-related risk for low-income communities and communities of color.

Respondent comments note involvement in community resilience work from other organization types and sub-types, including labor unions, faith-based organizations, health care organizations, for-profit companies outside the financial sector (e.g., for-profit environmental companies, B corporations), Tribes and other indigenous communities, think tanks, community foundations, schools and child care providers, and utilities.

Considerations for Policy and Practice

This brief assesses perceptions of climate-related risk for low-income communities and communities of color among professionals working on community development‒related issues in the western United States. Below is additional discussion on some of the themes in this brief.

Awareness and Engagement Levels on Community and Household Climate Risk

Given that the share of respondents who understand climate risk to their communities (83%) is much higher than the share whose organizations are working on it (39%), resources, capacity, and appropriate partnerships appear to be a bigger barrier than awareness. For researchers and conveners working on community development, the potential opportunity may be to share more nuanced resources about climate risk and how to address it, since there is already a basic level of awareness of climate risk in the field. Researchers and conveners could also share information about what groups are collaborating on climate resilience in different regions. However, there is a disconnect between these professionals’ knowledge and community members’ knowledge, in their opinion, given that 72% of respondents think resident lack of awareness of climate-related risk is a large or medium barrier to climate resilience efforts.

Lack of Housing Options in Resilient Areas as a Compounding Factor for Climate Risk

Respondents view a lack of housing options in resilient areas as the largest contributing factor to climate risk, with 72% of respondents saying that it contributes a large amount to climate risk for the communities they serve. Furthermore, 52% of respondents cite ongoing risk of housing displacement as a large contributor to climate risk for the communities they serve. This points to housing stability as important in improving community climate resilience. Increasing the housing supply to ensure there are housing options that are affordable at all income levels could help reduce climate-related risk for individuals and families. Research suggests that various factors contribute to the rising cost of apartment construction (e.g., in California).xxiii Different cities and regions have experimented with creating funds to kickstart subsidized affordable housing construction and preservation.xxiv

Lack of Savings Exacerbating Climate Risk

Lack of savings is the second-largest factor respondents view as exacerbating climate risk, with 62% of respondents identifying it as a large contributor to climate risk for the communities they serve. This suggests that understanding and addressing factors that constrain/reduce savings, such as the racial wealth gap, wage stagnation, and the racial income gap, could help prepare communities for climate risk. The racial wealth gap, a documented result of racialized policies and practices over time that persists even when controlling for education and income, puts communities of color at greater risk from climate-related disasters.xxv Research shows that “the typical White family has eight times the wealth of the typical Black family and five times the wealth of the typical Hispanic family.”xxvi Homeownership is the main source of wealth (assets minus liabilities) for middle-class Americans.xxvii Major contributors to the racial wealth gap include historic and ongoing discrimination—in home lending, xxviii, xxix the location of highway construction,xxx, xxxi neighborhood infrastructure investment, xxxii and home appraisalsxxxiii—that reduced/reduce homeownership rates and home values for communities of color, particularly African Americans.

Wage stagnation over timexxxiv and in the context of the pandemicxxxv also makes it challenging for low-income families to save in order to face expenses that arise from climate shocks and stresses, such as increased energy bills and disaster-related expenses. The racial income gap reduces savings, thereby increasing climate-related risk, particularly for communities of color.xxxvi Exclusionary zoning and the associated lack of access to quality K‒12 schools has contributed to the racial income gap over time. xxxvii Due to these structural factors, Blacks and Hispanics have a higher unemployment rate and are less likely to have a bachelor’s degree than Whites; even when they do hold a bachelor’s degree, Blacks and Hispanics are, on average, less likely to be in a profession that uses their degree, with discrimination and bias playing a likely role in these gaps.xxxviii

Climate Risk and Local Economies

Many respondents note the impacts on businesses and workers in local economies from disasters in recent years. A disaster or major weather event can damage homes or lead to business interruption, which impacts the local economy. Planned or unplanned power outages, temporary evacuation orders, and other disruptions to normal business can lead to loss of income that ripples through communities by means of rent payment, spending at other local businesses, and local tax revenue. Outdoor workers’ smoke exposure issues could be addressed through access to particulate-filtering masks, although extreme-heat days remain a health and safety risk. Air conditioning at warehouses could address heat-related health and safety risks for these workers. HEPA filters in workplaces and low-cost/DIY air filters in homes could help address health risks from particulate exposure due to wildfire smoke.xxxix Such measures as improving access to business continuity insurance and paid leave for workers could offset impacts of climate-related disasters on small businesses and workers.

Climate Risk and Housing Resilience

Making new and existing housing more resilient can reduce energy costs for individuals and families, which can improve their housing stability. In new construction, cost tradeoffs between the number of new units and efficiency measures can present an obstacle. Gaps exist in the funding for subsidized affordable housing between the normal cost per unit and the marginal cost of energy efficiency and renewable energy measures that save residents money on their utility bills in the long run. One respondent whose organization provides technical assistance to affordable housing developers comments that “some additional project costs (insulation, better windows) are already encouraged for energy efficiency, but others, such as fire-resilient cement siding/roofs [and] sprinklers in low-rise buildings, are too expensive to fit within funder-imposed cost caps.” For example, affordable-housing developers competing for federal Low-Income Housing Tax Credits (LIHTC) via state-run programs can face cost-per-unit limitations that make it challenging to incorporate renewable energy or energy-efficiency measures into homes. With rising costs of construction in general, and of subsidized affordable housing in particular, this has implications for housing stability and affordability.xl

Home weatherization is often a matter of thermal safety and health in the event of very high or very low temperatures and can reduce costs for low-income households.xli However, funding sources for retrofits do not always cover adjacent costs. For example, federal home weatherization funding, which supports such activities as insulating homes and weatherstripping windows, comes with a net savings requirement—the repairs/interventions must pay for themselves over time—and does not cover other adjacent repairs.xlii Many homes have underlying adjacent issues. For example, mold is becoming a larger issue as cooler places, like Alaska and the Pacific Northwest, experience higher temperatures than historically, as survey respondents note. Making a home less drafty with weatherization measures without addressing potential sources of moisture (e.g., poor ventilation) that can cause mold can create or exacerbate health issues for residents. A program in Oregon experiments with bridging this funding gap.xliii

Home solar photovoltaic (PV) arrays, which can reduce energy costs for residents, also often come with adjacent costs that existing funding sources for resilience measures do not support. For example, replacing an electrical panel or repairing/replacing a roof can be necessary to get an existing home ready for a solar PV array. Modern electrical panels, which many older, affordable homes lack, are also required for the installation of efficient/cost-reducing heat pump HVAC systems and appliances. Furthermore, research has suggested that on-bill repayment of the costs of solar PV and energy-efficiency retrofits can be predatory if pre- and post-installation audits are not conducted to confirm that the measures actually provide net savings for low-income homeowners.xliv

Conclusion

Professionals who work on community development‒related issues in the western United States are already working to address the climate shocks and stresses that they see impacting those they serve; however, in many cases, they lack resources, data, and opportunities for collaboration. Most respondents to our survey indicate that they already see climate-related risks impacting the communities they serve, but that communities and the organizations that serve them are not well prepared to face/address these risks. Respondents see organizations from different sectors as being involved to different degrees in existing efforts to reduce climate-related risk for the communities they serve. Although respondents report that the lingering pandemic and longer-term issues of racial and economic inequality are the most pressing issues facing families and communities, climate risks are compounding these issues. The availability of affordable housing in resilient areas is a particular barrier to reducing climate risk, as are issues of housing instability, accessibility to affordable transportation options, and health risks faced by outdoor workers. Climate-related risks vary by geography, and so do the potential ways to reduce these risks, particularly for low- and moderate-income communities and communities of color. More research is needed to understand specific climate-related risks and existing/potential efforts to address them, including through multisector collaboration, at the local and regional levels.

Methodological Appendix

A Note on Sampling

There is no mailing list of everyone in the western United States and Pacific territories whose work touches the lives of low-income communities and communities of color. Producing one would have been prohibitive for our team, both in terms of time and funding. We instead used a snowball sample, a type of convenience sample. It involves reaching out to a defined group of people—in this case, our team’s contacts in the community development field—and “snowballing” to their contacts. As respondents recommend the survey to others, the sample size grows, as with an actual snowball that one rolls.xlv Handcock and Gile (2011) point out that a snowball sample is a way to reach a population that is either impossible or impractical to reach otherwise; it results in a nonprobability sample—in other words, one that is not representative of a population.xlvi A snowball sample can result in selection bias, as Sedgwick (2013) notes.xlvii With our sampling method, we attempted to reach as many stakeholders as possible, with representation across a range of sectors (public, private, nonprofit, etc.), organizational missions (environmental and nonenvironmental), and across our target geographies (nine western states and Pacific territories). Our results are not intended to be statistically representative, but rather to give the best available snapshot of the field. We attempted to reduce selection bias of those whose work already focuses primarily on climate-related issues through targeted outreach to nonenvironmental organizations.

The views expressed in this report are those of the authors and do not necessarily reflect the views of the Federal Reserve Bank of San Francisco or the Federal Reserve System.

Acknowledgments

We would like to thank Laura Choi, Joselyn Cousins, Jon Ford, Laurel Gourd, Rocio Sanchez-Moyano, Bina Shrimali, and Lina Stepick at the SF Fed and Teri Benelli at LISC Phoenix for their contributions to the development of the survey and comments on this brief. Leilani Barnett, Laura Choi, Jessica Coria, Joselyn Cousins, Naomi Cytron, Laurel Gourd, and Craig Nolte contributed invaluable outreach.

End Notes

i. National Climate Assessment. 2018. Summary Findings, pp. 2‒3.

ii. National Climate Assessment. 2018. Chapter 14, Key Message 2.

iii. National Climate Assessment. 2018. Chapter 14, Figure 14-2.

iv. Hsiang, Solomon, et al. 2017. “Estimating Economic Damage from Climate Change in the United States.” Science 356 (6345): 1362‒69.

v. Keenan, Jesse M., and Elizabeth Mattiuzzi. 2019. “Climate Adaptation Investment and the Community Reinvestment Act.” Federal Reserve Bank of San Francisco Community Development Research Brief 2019-5.

vi. Trounstine, Jessica. 2018. Segregation by Design: Local Politics and Inequality in American Cities. Cambridge: Cambridge University Press. pp. 2‒3.

vii. Daly, Mary C. 2019. “Why Climate Change Matters to Us.” [Speech].

viii. The survey instrument, which is no longer active, can be viewed online in archive form.

ix. Mattiuzzi, Elizabeth. June 24, 2021. “Survey: Understanding Climate-Related Risks Faced by Low- and Moderate-Income Communities and Communities of Color.” Federal Reserve Bank of San Francisco Community Development Blog.

x. For more discussion on our survey methods, see the Methodological Appendix section.

xi. Board of Governors of the Federal Reserve. 2019. Report on the Economic Well-Being of U.S. Households in 2018‒2019.

xii. Ricketts, Lowell, and Ray Boshara. May 1, 2020. “Which Families Are Most Vulnerable to an Income Shock Such as COVID-19?” Federal Reserve Bank of St. Louis. In the Balance.

xiii. Raval, Amee, et al. 2019. “Mapping Resilience: A Blueprint for Thriving in the Face of Climate Disasters.” Asian Pacific Environmental Network (APEN) Report, pp. 38, 69.

xiv. Keith, Ladd, Sara Meerow, and Tess Wagner. 2019. “Planning for Extreme Heat: A Review.” Journal of Extreme Events 6 (3&4).

xv. Park, R. Jisung, Joshua Goodman, Michael Hurwitz, and Jonathan Smith. 2020. “Heat and Learning.” American Economic Journal: Economic Policy 12 (2): 306‒39.

xvi. Postma, Julie. 2020. “Protecting Outdoor Workers from Hazards Associated with Wildfire Smoke.” Workplace Health & Safety 68 (1): 52. doi:10.1177/2165079919888516.

xvii. Flaccus, Gillian. July 13, 2021. “Oregon Heat Wave Victims Older, Lived Alone, Had No AC.” Associated Press News.

xviii. Radeloff, Volker C., et al. 2018. “Rapid Growth of the U.S. Wildland-Urban Interface Raises Wildfire Risk.” Proceedings of the National Academy of Sciences 115 (13): 3314‒19.

xix. Fridirici, Roxane. 2008. “Floods of People: New Residential Development into Flood-Prone Areas in San Joaquin County, California.” Natural Hazards Review 9 (3): 158‒68.

xx. Jergler, Don. September 29, 2021. “Report Shows Wyoming, Idaho Have ‘Disproportionate Risk’ from Wildfire.” Insurance Journal.

xxi. Battisto, Jessica, Laura Choi, Claire Kramer Mills, Elizabeth Mattiuzzi, Emily Ryder Perlmeter, and Samuel Storey. 2018. “2017 Small Business Credit Survey: Report on Disaster-Affected Firms.” Dallas, New York, Richmond, San Francisco: Federal Reserve Banks of Dallas, New York, Richmond, and San Francisco.

xxii. Méndez, Michael, Genevieve Flores-Haro, and Lucas Zucker. 2020. “The (In) visible Victims of Disaster: Understanding the Vulnerability of Undocumented Latino/a and Indigenous Immigrants.” Geoforum 116: 50‒62.

xxiii. Raetz, Hayley, Elizabeth Kneebone, Carolina Reid, and Teddy Forscher. 2020. “The Hard Costs of Construction: Recent Trends in Labor and Materials Costs for Apartment Buildings in California.” Berkeley, CA: Terner Center for Housing Innovation, UC Berkeley.

xxiv. Mattiuzzi, Elizabeth. 2019. “Funds for Kickstarting Affordable Housing Preservation and Production: Lessons for New Investors.” Federal Reserve Bank of San Francisco Community Development Research Brief 2019-02.

xxv. Bhutta, Neil, Andrew C. Chang, Lisa J. Dettling, Joanne W. Hsu, and Julia Hewitt. September 28, 2020. “Disparities in Wealth by Race and Ethnicity in the 2019 Survey of Consumer Finances.” Board of Governors of the Federal Reserve FEDS Notes.

xxvi. Ibid.

xxvii. Kuhn, Moritz, Moritz Schularick, and Ulrike I. Steins. 2020. “Income and Wealth Inequality in America, 1949–2016.” Journal of Political Economy 128 (9): 3469‒519.

xxviii. Rothstein, Richard. 2017. The Color of Law: A Forgotten History of How Our Government Segregated America. New York: Liveright.

xxix. Qullian, Lincoln, John J. Lee, and Brandon Honoré. 2020. “Racial Discrimination in the U.S. Housing and Mortgage Lending Markets: A Quantitative Review of Trends, 1976–2016.” Race and Social Problems 12: 13–28.

xxx. Karas, David. 2015. “Highway to Inequity: The Disparate Impact of the Interstate Highway System on Poor and Minority Communities in American Cities.” New Visions for Public Affairs 7: 9‒21.

xxxi. Dillon, Liam, and Ben Poston. November 11, 2021. “Freeways Force Out Residents in Communities of Color — Again.” Los Angeles Times.

xxxii. Trounstine, Jessica. 2018. Segregation by Design: Local Politics and Inequality in American Cities. Cambridge: Cambridge University Press.

xxxiii. Howell, Junia, and Elizabeth Korver-Glenn. 2020. “The Increasing Effect of Neighborhood Racial Composition on Housing Values, 1980–2015.” Social Problems 68 (4): 1051‒71.

xxxiv. Desilver, Drew. 2018. “For Most U.S. Workers, Real Wages Have Barely Budged in Decades.” Pew Research Center.

xxxv. Crust, Erin E., Mary C. Daly, and Bart Hobijn. August 31, 2020. “The Illusion of Wage Growth.” FRBSF Economic Letter 2020-26.

xxxvi. Dettling, Lisa J., et al. September 27, 2017. “Recent Trends in Wealth-Holding by Race and Ethnicity: Evidence from the Survey of Consumer Finances.” Board of Governors of the Federal Reserve FEDS Notes.

xxxvii. Whittemore, Andrew H. 2021. “Exclusionary Zoning: Origins, Open Suburbs, and Contemporary Debates.” Journal of the American Planning Association 87 (2): 167‒80.

xxxviii. Buckman, Shelby R., Laura Y. Choi, Mary C. Daly, and Lily M. Seitelman. 2021. “The Economic Gains from Equity.” Federal Reserve Bank of San Francisco Working Paper 2021-11.

xxxix. Puget Sound Clean Air Agency. 2021. “DIY Air Filter.”

xl. Reid, Carolina. 2020. “The Costs of Affordable Housing Production: Insights from California’s 9% Low-Income Housing Tax Credit Program.” Berkeley, CA: Terner Center for Housing Innovation, UC Berkeley.

xli. U.S. Environmental Protection Agency. “Climate Change Indicators: High and Low Temperatures.”

xlii. Violette, Daniel M., and Pamela Rathbun. 2014. “The Uniform Methods Project: Methods for Determining Energy Efficiency Savings for Specific Measures.” National Renewable Energy Laboratory (NREL).

xliii. Gould, Katie. 2021. “Oregon Experiments with Healthy Homes Repair Fund.” Sightline Institute.

xliv. Polsky, Claudia, et al. 2021. “The Dark Side of the Sun: How PACE Financing Has Under-Delivered Green Benefits and Harmed Low-Income Homeowners.” Berkeley Law School Environmental Law Clinic.

xlv. Sedgwick, Philip. 2013. “Snowball Sampling.” BMJ [British Medical Journal] 347. doi: 10.1136/bmj.f7511.

xlvi. Handcock, Mark S., and Krista J. Gile. 2011. Sociological Methodology 41 (1). doi: 10.1111/j.1467-9531.2011.01243.x.

xlvii. Sedgwick, 2013.

Article Citation

Mattiuzzi, Elizabeth, and Eileen Hodge. 2021. “Climate-Related Risks Faced by Low- and Moderate-Income Communities and Communities of Color: Survey Results.” Federal Reserve Bank of San Francisco Community Development Research Brief 2021-3. doi: 10.24148/cdrb2021-3