

Financial markets repriced assets across a wide range of sectors following the U.S. trade policy announcement on April 2, 2025. Analysis suggests that market participants interpreted tariffs to have direct effects not only on companies in the sectors involved but also indirect effects on overall demand. Investors expected declines in corporate profits to be persistent both in the United States and abroad. The U.S. dollar depreciated against other safe-haven currencies, which points to investors reallocating their portfolios away from the United States and toward other markets.
Trade policy in the United States changed markedly in 2025, with significantly higher tariffs proposed for most trading partners. The biggest announcement was on April 2, 2025: The United States would apply a 10% minimum tariff rate on imports, as well as a “reciprocal tariff” proportional to each country’s bilateral trade imbalance with the United States (Executive Order 14257). Both the size and scope of the trade policy significantly exceeded financial market expectations, leading to a sharp repricing of the U.S. stock market, U.S. Treasury yields, and exchange rates (see Jiang et al. 2025). While many asset prices have since rebounded, analyzing this event can improve our understanding of the perceived effects of tariffs and generally of news surprises on financial markets.
This Economic Letter examines the initial reaction of financial market prices to the April 2, 2025, tariff announcement across a range of securities, including stocks, credit default swaps, dividend futures, and exchange rates. We rely on event-study analysis, similar to our earlier study of the stock market response at the onset of the COVID-19 pandemic (Kwan and Mertens 2020). Our results show that financial market participants perceived the change in trade policy as being likely to reduce corporate profits over the longer term in both the United States and other countries.
The repricing of the U.S. stock market
Between April 2 and April 4, 2025, the U.S. stock market experienced one of its sharpest declines in decades. During this two-day period, the Standard and Poor’s (S&P) 500 stock index dropped 11%, with the energy sector registering the worst performance, falling 17%, while the best performing consumer staples fell 4%. The decline in stock valuations affected firms in all sectors of the economy. This likely reflected investors revising their expectations of future cash flows, an increase in perceived uncertainty, and lower risk tolerance.
The change in a firm’s stock price can be broken down into a systematic component—the co-movement with the broader stock market—and an idiosyncratic component that is specific to a business or sector. The systematic component captures both news about overall cash flows and changes in risk pricing. The abnormal stock returns by sector provide a market-based measure of the additional impact of an event on a sector, beyond what would be expected from the broader market reaction.
The abnormal return of a firm’s stock on a given day is the difference between its actual return and a reference return derived from the Capital Asset Pricing Model, as in Sharpe (1964), encompassing the stock’s systematic co-movement with the market. When the event window is greater than one trading day, we cumulate the abnormal returns over the event window to yield the cumulative abnormal return.
To make statistical inferences, we divide the cumulative abnormal return by its standard deviation to yield the standardized cumulative abnormal return (SCAR), which is measured as a t-statistic as in MacKinlay (1997). After accounting for the systematic risk or co-movement with the market, the SCAR isolates the sector-specific shock from the broader stock market shock.
Figure 1 shows the SCARs from April 2 to April 4 for each of the 11 sectors in the S&P 500, computed by value-weighting company stock returns in each sector. The April 2 tariff announcement had significantly different and unexpected effects across sectors as measured by the SCAR that compares a sector’s return to its benchmark.
Figure 1
Standardized cumulative abnormal returns by sector
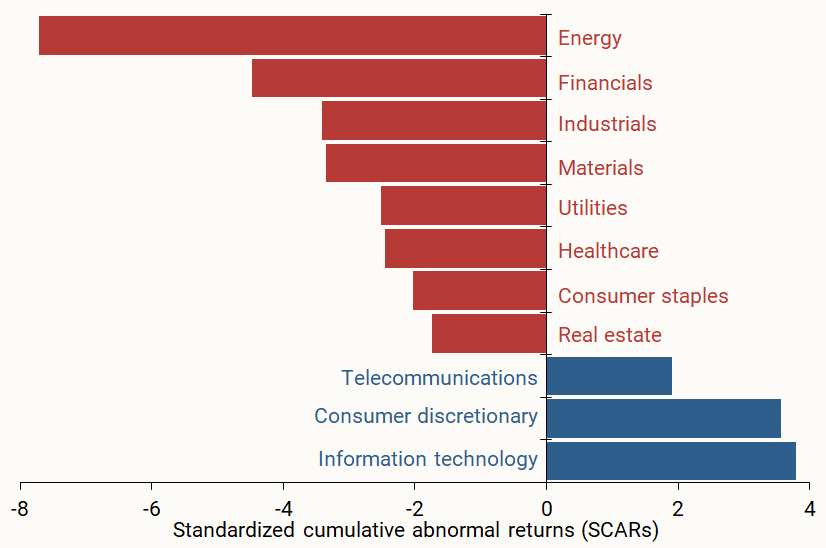
Source: Authors’ calculations using stocks data obtained from Bloomberg.
Firms in eight of these sectors—energy, financials, industrials, materials, utilities, healthcare, consumer staples, and real estate—had significantly negative abnormal stock returns (red bars), indicating that investors expected the tariff announcement to have a negative impact on these firms beyond the systematic effects on the broad economy. The large negative abnormal stock returns for financial firms signaled higher financial risk, and the large negative abnormal stock returns for firms in the energy, utilities, industrials, and materials sectors pointed to lower expected economic activity ahead. The combination of elevated financial risk and lower expected economic growth is consistent with markets perceiving a higher probability of an economic slowdown.
Since firms in the financial and real estate sectors do not have much direct exposure to international trade, their underperformance is likely due to indirect exposure, such as from lending to trade-exposed borrowers, or exposure to broader macroeconomic conditions more generally.
On the other hand, firms in telecommunications, consumer discretionary, and information technology sectors had significantly positive abnormal stock returns (blue bars), indicating that these firms were relatively shielded from the tariff announcement. However, not all stocks within a sector responded equally. For example, the information technology sector’s so-called “magnificent 7” firms had different SCARs, ranging from significantly positive to significantly negative, likely reflecting differences in supply chains and production processes across these firms.
The credit default swaps market
To examine whether the perceived default risk for firms increased, we investigate measures of credit risk from financial markets through spreads on credit default swaps (CDS). A CDS is a financial contract that pays off in the event of a default and thus reflects market-based assessments of the likelihood of significant impacts on corporate cash flows. Debt holders can use CDS to insure against losses on their bond position.
Figure 2 shows the changes in CDS spreads across sectors in response to the April 2 tariff announcement, led by CDS of high-yield corporate bonds. The market priced in higher corporate default risk, especially among firms in the financial, energy, and consumer discretionary sectors. Broadly consistent with our findings from the stock market, evidence from the CDS market indicates higher perceived risk, particularly for energy and financials. The one exception is the strong increase in perceived higher default risk for the consumer discretionary sector, which contrasts sharply with the sector’s positive SCAR. This discrepancy may in part reflect that CDS are only based on the probability of default risk but could also be due to imprecise measurement of the reference return for computing the SCAR.
Figure 2
Level changes in CDS spreads by sector, April 2-4
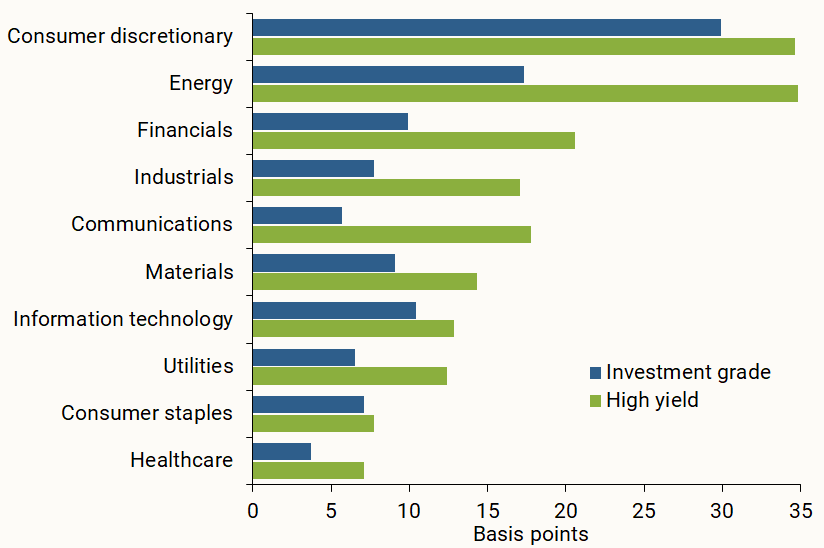
Source: Authors’ calculations using CDS data obtained from Bloomberg.
Evidence from dividend futures
To disentangle investors’ adjusted growth expectations from the changes in the discount rate following the tariff announcement, we use data collected from the dividend futures market. Dividend futures are claims to dividends on the aggregate stock market at a future time and are available for stock market indexes in the United States (S&P 500), the euro zone (Euro Stoxx 50), and Japan (Nikkei 225). Using dividend futures with different maturities, the resulting term structure provides the market’s assessment of how firm profits are expected to evolve over time and across different economies.
Figure 3 shows the percentage change in the term structure of dividend futures prices between April 2 and April 4 for the S&P 500, the Euro Stoxx 50, and the Nikkei 225. Over this period, dividend expectations for the S&P 500 fell the most, a drop of 6–8% over three years. Expected dividends for the Euro Stoxx fell similarly, while expected dividends for the Nikkei fell about 3–5%. These findings suggest that the impact of changes in trade policy on corporate profits were perceived to be substantial and persistent.
Figure 3
Term structure of dividend futures prices, April 2-4
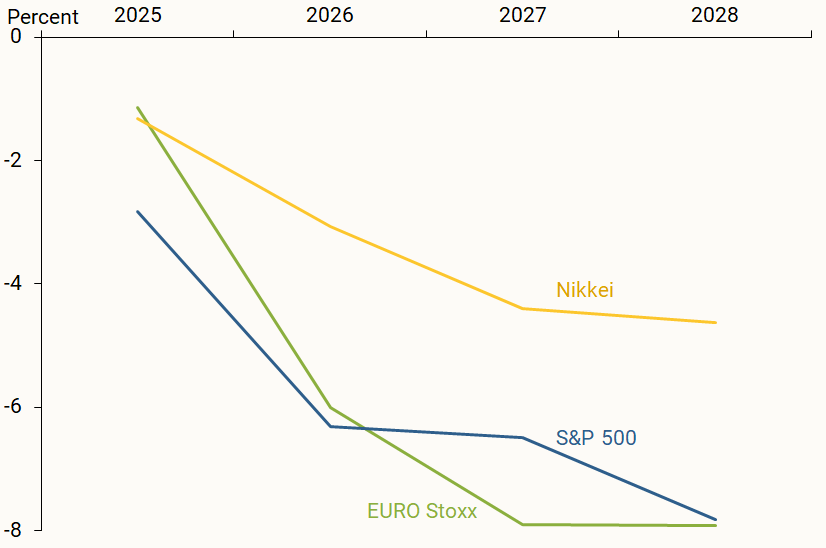
Source: Authors’ calculations using data from Bloomberg.
International developments
The decline in dividend futures suggests that other major stock markets also fell after the tariff announcement. We therefore compare stock market reactions to the announcement across countries. We choose the MSCI World Index to represent the world market, and compute SCARs from April 2 to April 4 for each of the 23 markets in the developed economies covered by the index, including the United States.
All of the stock markets in the MSCI World Index fell over the two-day period, with cumulative declines ranging from 1% to 11%. Despite the U.S. market experiencing the largest decline in its stock valuations, its SCAR was not significantly different from zero. Because the U.S. market tends to comove strongly with world markets, the reference return declined strongly, and the SCAR thus fell close to zero due to its high exposure to world market movements. Stock markets in six developed countries—the United Kingdom, Italy, Norway, Switzerland, Austria, and Spain—had significantly negative SCARs. Consistent with evidence from the dividend futures market, the United Kingdom and countries in the euro area were expected to be particularly affected by the tariff announcement, according to the fall in their stock markets. These results are consistent with tariffs being perceived as an aggregate shock to which some countries, including the United Kingdom and those in the euro area, were particularly exposed.
We provide further evidence on the market reaction from foreign currency exchange markets. Similar to the analysis for stock markets, we compute SCARs for different currencies from April 2 to April 4. In Figure 4, a positive value refers to a cumulative abnormal appreciation of the U.S. dollar in the bilateral exchange rate, while a negative number refers to abnormal U.S. dollar depreciation. Figure 4 shows that, following the tariff shock, safe-haven currencies, such as the Swiss franc, Japanese yen, and euro, generally appreciated against the U.S. dollar, while risk-sensitive currencies like the Australian dollar and New Zealand dollar depreciated. A similar pattern is evident for a wide set of other currencies not shown in the chart. Overall, the results suggest a rebalancing by international investors away from the United States and toward other countries.
Figure 4
SCARs for exchange rates, April 2-4

Source: Authors’ calculation using exchange rate data obtained from Bloomberg
Conclusions
In this Letter, we analyze financial market data from the stock market, the CDS market, the dividend futures market, and the foreign exchange market to assess reactions to the April 2 U.S. tariff announcement. In the United States, not only firms in sectors most exposed to trade but also those in sectors with a larger exposure to macroeconomic conditions experienced pronounced declines in stock valuations. Dividend futures signaled lower expectations of future corporate profits, and evidence from the CDS market is consistent with investors perceiving increased downside risks for the U.S. economy. In addition, the U.S. dollar depreciated against other safe-haven currencies and experienced an abnormal appreciation against risk-sensitive currencies.
Taken together, our results imply that financial market participants viewed the April 2 tariff announcement as having direct effects on firms that are highly exposed to trade while also creating broader macroeconomic repercussions.
References
Executive Order No. 14257 of April 2, 2025. “Regulating Imports with a Reciprocal Tariff to Rectify Trade Practices That Contribute to Large and Persistent Annual United States Goods Trade Deficits.” Code of Federal Regulations 90 FR 15041, Document number 2025-06063.
Jiang, Zhengyang, Arvind Krishnamurthy, Hanno Lustig, Robert J. Richmond, and Chenzi Xu. 2025. “Dollar Upheaval: This Time Is Different.” Stanford Institute for Economic Policy Research (SIEPR) Working Paper 25-18. April.
Kwan, Simon, and Thomas M. Mertens. 2020. “Market Assessment of COVID-19.” FRBSF Economic Letter 2020-14 (May 28).
MacKinlay, A. Craig. 1997. “Event Studies in Economics and Finance.” Journal of Economic Literature 35(1), pp. 13–39.
Sharpe, William F. 1964. “Capital Asset Prices: A Theory of Market Equilibrium Under Conditions of Risk.” Journal of Finance 19(3), pp. 425–442.
Opinions expressed in FRBSF Economic Letter do not necessarily reflect the views of the management of the Federal Reserve Bank of San Francisco or of the Board of Governors of the Federal Reserve System. This publication is edited by Anita Todd and Karen Barnes. Permission to reprint portions of articles or whole articles must be obtained in writing. Please send editorial comments and requests for reprint permission to research.library@sf.frb.org