

Nicolas Petrosky-Nadeau, vice president at the Federal Reserve Bank of San Francisco, shared views on the current economy and the outlook from the Economic Research Department as of January 15, 2026.
Monthly job growth, a measure of labor demand, slowed to a near halt in 2025, but the unemployment rate increased only modestly. This apparent puzzle is explained by the slowing of labor supply and labor demand in tandem. Job growth in recent months has been concentrated in a single sector—education and health services—and some groups’ participation in the labor force has declined, two factors signaling potential labor market fragility going forward. In contrast, recent economic activity has come in stronger than expected, and near-term projections have been revised up, lowering perceptions of recession risks. After increasing midyear on the heels of changes in tariff policy, headline personal consumption expenditures (PCE) inflation is expected to resume its progress towards the Federal Reserve’s 2% goal in 2026.
Job growth slowed significantly, but unemployment increased only modestly
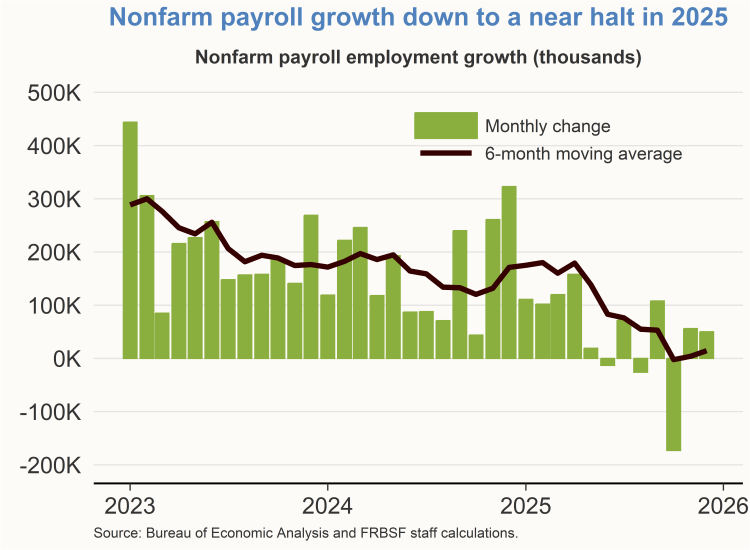
Job growth started 2025 on solid footing. Nonfarm payroll employment from the Bureau of Labor Statistics’ (BLS) Current Employment Statistics (CES) averaged 123,000 new jobs per month over the first four months of 2025, a solid pace of job creation. The picture began to change notably in May 2025. Indeed, the second half of 2025 recorded three months with outright declines in payroll employment, and average job growth fell to just 15,000 per month.
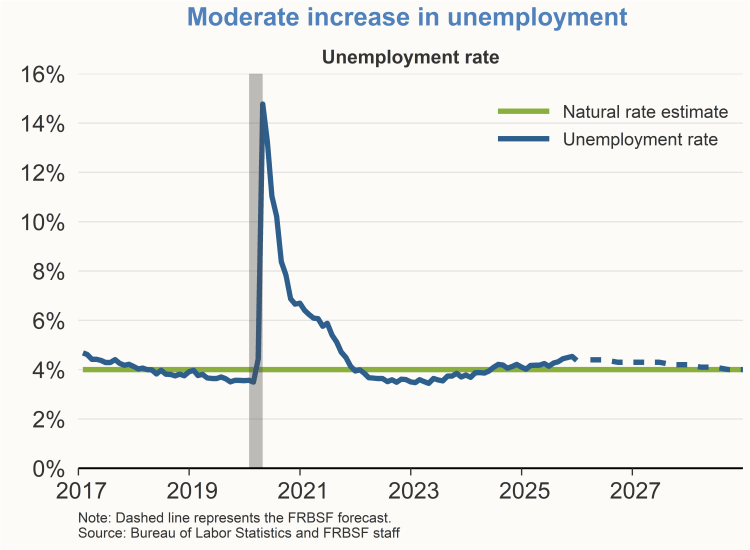
A deceleration in job growth of this size would typically be associated with a significant increase in the unemployment rate. Estimates of the “breakeven” level of job growth, that is, the pace of job gains needed to absorb growth in the labor force with the unemployment rate unchanged, are typically in a range of 70,000 to 90,000 jobs per month. However, we have seen only a modest increase in the unemployment rate, rising from 4.2% in April 2025 to 4.4% in December 2025. The unemployment rate is expected to remain near its current level for much of 2026, before it gradually returns to our estimated longer-run level of 4%.
Labor supply and labor demand slowing in tandem
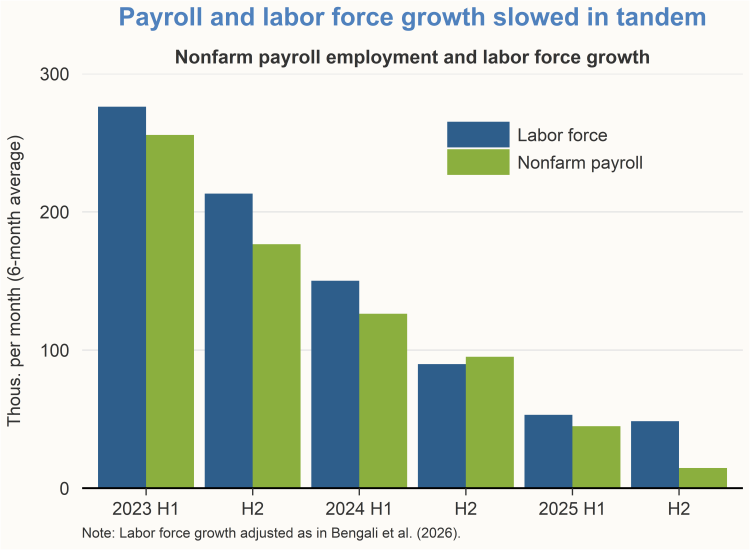
This seeming puzzle of a relatively stable unemployment rate in the face of sharp declines in job growth can be explained by a balanced slowdown in both labor supply and labor demand. Specifically, growth in the size of the labor force (labor supply) has slowed at close to the same pace as new job growth (labor demand). Recent research by Bengali, et al. (2026) identifies this tandem slowdown pattern going back to early 2023. This pattern becomes apparent once adjustments are made to the labor force numbers that align the measurement of jobs in the BLS’s Current Population Survey on some definitional dimensions with the CES and that address issues in measuring rapid changes in net migration and their impact on labor force growth.
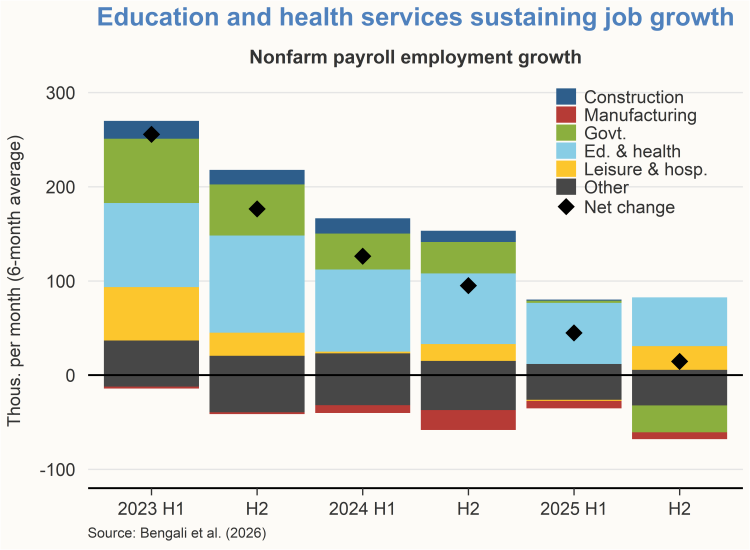
The recent decline in job growth has been broad based across sectors, indicating a widespread slowing of labor demand. However, the vast majority of job growth in 2025 was limited to a single sector—education and health services—with other sectors losing jobs or showing almost no job growth. For example, the government sector, which had been a significant source of job growth in prior years, lost jobs in the second half of 2025.

Recent declines in the size of the labor force have been driven by changes in net immigration flows and a declining labor force participation (LFP) rate among the native-born population. The latter development suggests a weaker environment for workers as LFP rates tend to respond to the cyclical strength of the labor market. Overall, these two factors—job gains concentrated in a single sector and declining LFP rates—signal potential labor market fragility going forward.
But there is some cause for optimism
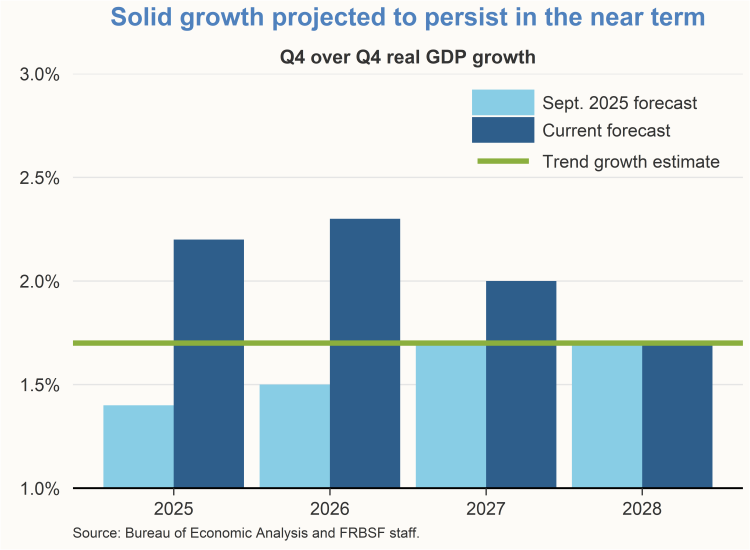
In contrast to signs of potential fragility in the labor market, real GDP growth was stronger than anticipated in the third quarter of 2025. Third quarter growth came in at 4.3% on an annualized basis, significantly above our forecast recorded in September 2025. We now expect an above-trend pace for real GDP growth in both 2026 and 2027, followed by a gradual slowing to our estimated 1.7% trend growth by the end of the forecast horizon. This stronger growth forecast is based on projections of robust consumer spending, increased capital expenditures by firms, and a pickup in productivity growth.
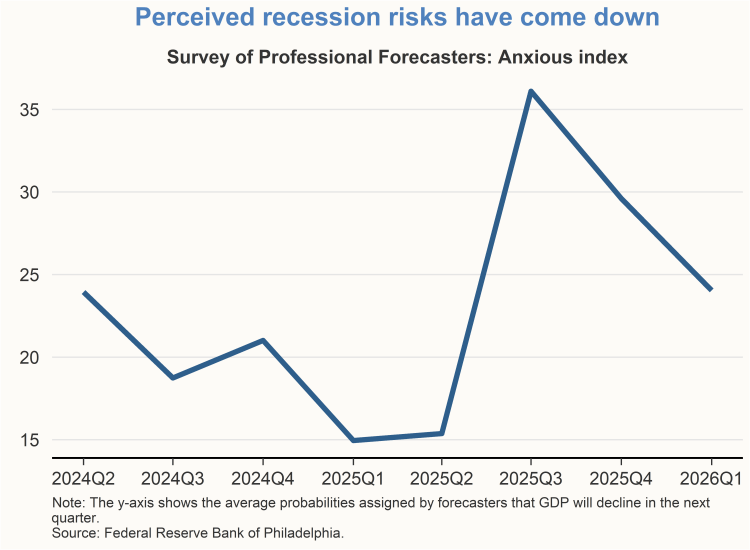
Confidence in the economic growth outlook appears to be spreading. Respondents to the Federal Reserve Bank of Philadelphia’s Survey of Professional Forecasters were notably concerned in June 2025 about rising recession risks. In that month, the survey, also known as the Anxious Index, recorded an average probability of a real GDP decline over the coming quarter of 36%, up from just 15% in March 2025. But as of December 2025, the index had declined to 24%.
Inflation projected to resume decline towards 2%
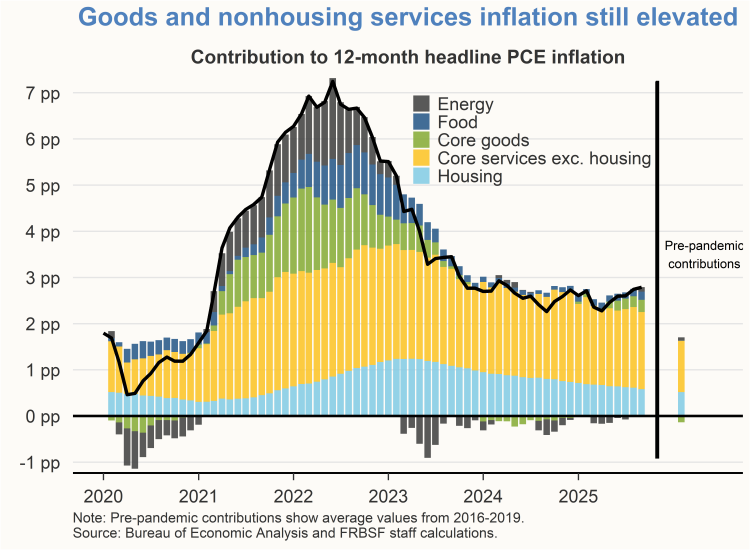
Upward inflation pressures from recent changes in trade policy have been less acute than initially expected. Nevertheless, data though September 2025 indicate recent trade policy actions have pushed up core goods inflation and have slowed progress towards the Federal Reserve’s longer-run inflation goal of 2%, as measured by the 12-month change in the PCE price index. Broader spillovers of trade policy actions to services inflation have so far been limited, while housing inflation has slowed notably and is now approaching its pre-pandemic average. Upward inflation pressure from rising core goods prices is expected to subside in 2026. However, the stubborn persistence of nonhousing core services inflation in recent quarters poses an upside risk to the inflation outlook.
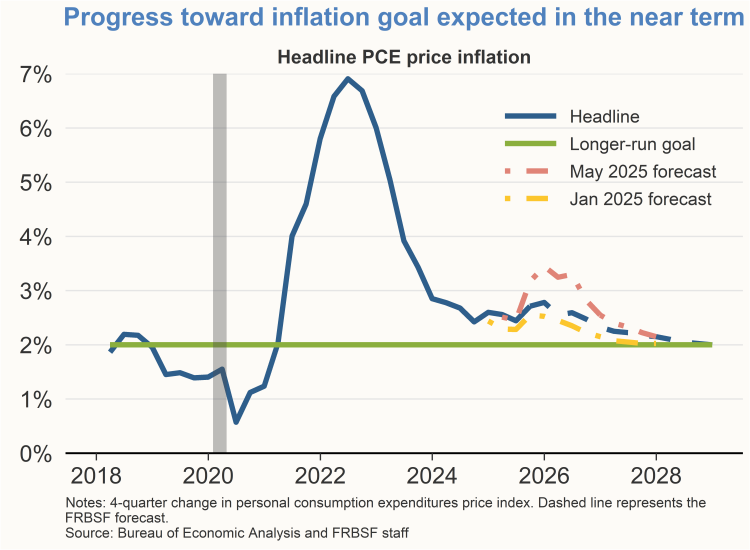
All together, we expect four-quarter headline PCE inflation to slow to 2.3% by the end of 2026, followed by a further decline, and by the end of 2027 approaching 2%. While this projection is more favorable now than in May 2025, the current projected inflation path remains somewhat elevated relative to our projection at the start of 2025.
Expected monetary policy path
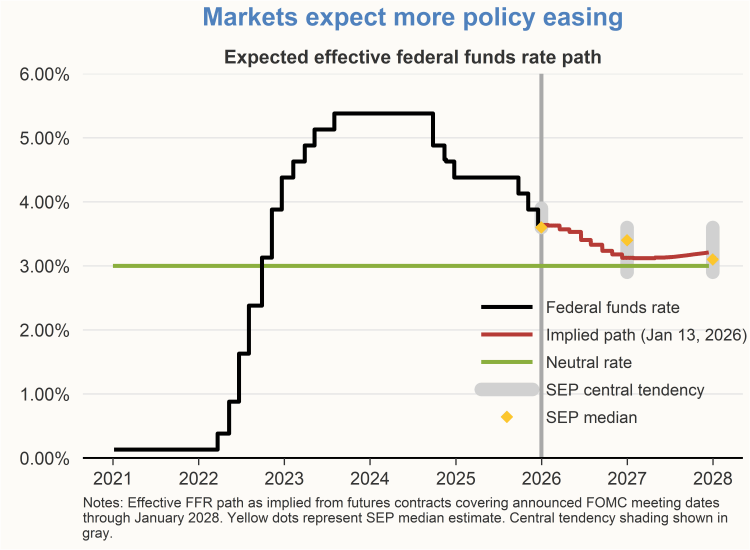
Given the recent evolution of the data, policymakers have indicated that some additional monetary policy easing will likely be needed in 2026. The median projection for the year-end value of the federal funds rate from the December 2025 Summary of Economic Projections (SEP) indicated that one 25 basis point cut in the funds rate would be appropriate in 2026, followed by another 25 basis point cut in 2027. In contrast, financial market participants expect the second 25 basis point cut to be pulled forward into 2026.
Charts were produced by Ingrid Chen and Sabrina Considine.
The views expressed are those of the author with input from the Federal Reserve Bank of San Francisco forecasting staff. They are not intended to represent the views of others within the Bank or the Federal Reserve System. This publication is edited by Kevin J. Lansing, Karen Barnes, and Hamza Abdelrahman. SF FedViews appears eight times a year. Please send editorial comments to Research Library.