
The Federal Reserve designed its Paycheck Protection Program Liquidity Facility to ease liquidity issues and support small business lending during the pandemic. The liquidity facility allowed banks to pledge Paycheck Protection Program loans as risk-free collateral during the beginning of the COVID-19 pandemic. Analysis shows that, although the program has essentially ended, the positive effects on small business lending have persisted, particularly among small banks with lower liquidity, in keeping with the intent of the program.
Congress created the Paycheck Protection Program (PPP) during the COVID-19 pandemic to assist small businesses in retaining employees and covering their expenses. Administered by the Small Business Administration, the program allowed qualified small and medium enterprises (SMEs) to obtain guaranteed loans from banks. To encourage banks to participate, the Federal Reserve established the Paycheck Protection Program Liquidity Facility (PPPLF), which allowed banks to make PPP loans without impairing their balance sheet liquidity. Under the PPPLF, banks could use PPP loans as risk-free collateral for Federal Reserve borrowing (Anbil, Carlson, and Styczynski 2023). Approximately 1,300 banks participated in the PPPLF, with close to 15% of PPP loans pledged as collateral (Lopez and Spiegel 2023).
In Dufresne and Spiegel (2025), we examined the longer-term effects of the PPP and the PPPLF on lending to SMEs. We found that elevated bank participation in both programs was associated with a substantial increase in average conventional SME lending growth by small banks. This lasted long after PPP loans had been largely eliminated through loan repayment or forgiveness. While some bank exposure to conventional SME lending declined when PPP-related loans ended, the net long-term impact on SME lending remained positive. We concluded that participation in the PPP and PPPLF programs fostered persistent SME banking relationships, despite the reduced incentives for forming such relationships under the PPP’s government lending guarantees. While the PPP had significant positive effects on persistent SME lending for all bank sizes, statistically significant impacts of the Federal Reserve’s PPPLF were limited to small banks, for whom the liquidity program was largely intended.
In this Economic Letter, we extend the analysis in Dufresne and Spiegel (2025) to examine the intensity of PPPLF participation effects across groups of small banks with different characteristics. Our results indicate that the average effects reported in our earlier paper mask differences in the program’s impacts. We find that the persistent lending effects are driven primarily by banks that had lower liquidity, higher shares of tradable assets, and lower capital ratios before the pandemic.
Pandemic-era programs and small business lending
The PPP was very large, extending loans of about $793 billion in total. By October 2023, over $762.4 billion worth of that lending had been forgiven. The program was also controversial. Some argued that the involvement of commercial banks distorted the allocation of funds (see, for example, Chernenko and Scharfstein 2024), or that it yielded only modest employment benefits (see, for example, Granja et al. 2022). But most studies found that both the PPP and PPPLF programs did succeed in encouraging immediate expansion of overall SME lending during the pandemic (see, for example, Lopez and Spiegel 2023).
Figure 1 summarizes the evolution of total bank PPP and conventional SME lending, as reported in regulatory filings in the Federal Reserve’s Call Report, from 2017 through the end of 2024. Total PPP and conventional SME lending both increased markedly during the pandemic, then fell modestly below trend after the pandemic’s end. By 2023, participation in both the PPP and PPPLF programs was close to zero.
Figure 1
Total small business bank lending, 2017–2024

Persistent effects of PPPLF lending
Following the introduction of the PPP during the first half of 2020, conventional SME lending experienced a pronounced increase alongside the high number of PPP loans. Figure 1 shows that total lending to SME firms more than doubled over the six-month period. After the peak of the pandemic, PPP exposure fell precipitously, as loans were forgiven or paid off. By the end of our sample, lending levels failed to recover to the linear growth trend (black line) that prevailed before the pandemic. This suggests that some scarring in SME lending persisted even after the recovery from the pandemic.
In Dufresne and Spiegel (2025), we investigated the implications of PPPLF participation for persistent conventional SME lending. We measured bank PPPLF participation as the share of PPP loans used as collateral in PPPLF borrowing relative to overall conventional and PPP small business lending at the height of the pandemic in mid-2020. We used that metric because a simple ratio of PPP to PPPLF lending would be undefined for the roughly 300 banks in the sample with no participation in either program. Instead, banks with no participation in either program are considered as having no participation in the PPPLF program.
Our results demonstrated that, despite the fall in overall SME lending exposure relative to the trend, bank PPPLF participation had positive and statistically significant implications for relative average annual growth in conventional SME lending between the end of 2019 and the end of 2024. This was long after almost all PPP loans had been forgiven or repaid.
However, after PPP loans had effectively been reduced to zero, we found that SME lending was negatively related to PPPLF participation during the pandemic, as measured at the end of the first half of 2020. This appears to reflect a decrease in some lending after the programs induced more conventional SME exposure than banks desired. Still, the additional downturn in PPPLF-related SME lending among those banks with high levels of PPPLF participation during the latter half of our sample period was much smaller than their relatively large initial surge during the pandemic. As a result, net PPPLF-related SME lending remained persistently elevated for banks with larger participation by the end of the pandemic programs.
The impact of the PPPLF on long-term SME lending growth was greatest for small banks, while medium and large banks showed no significantly positive impact. This likely reflects that medium and large banks depended less on the PPPLF because the share of PPP loans in their overall lending was smaller. We therefore restrict our analysis here to our subsample of 3,852 small banks.
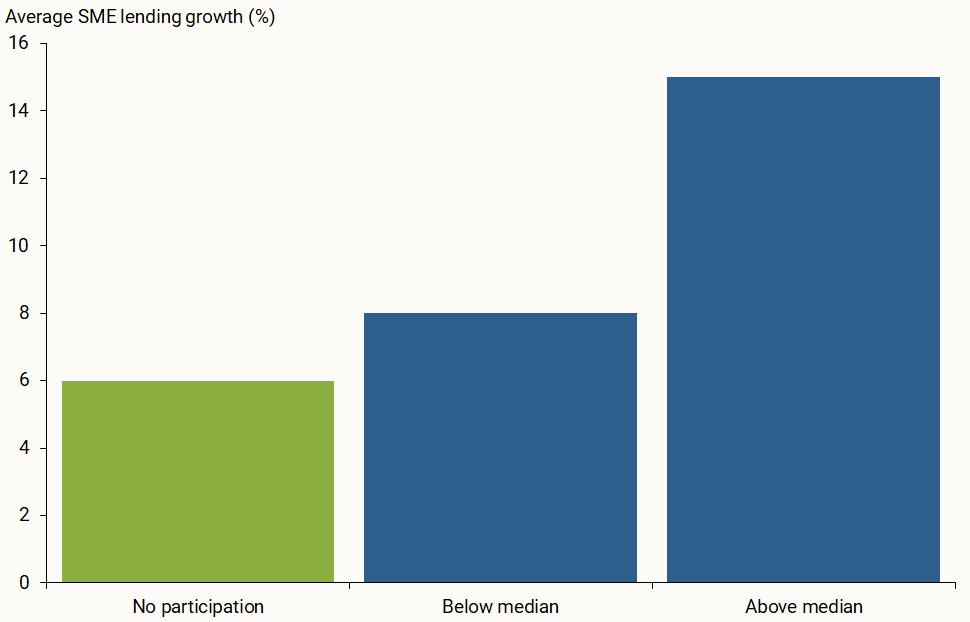
Figure 2 shows the relationship between PPPLF participation and persistent conventional SME small bank lending, dividing our small bank sample into three groups. The green bar shows average lending growth for small banks that did not participate in the PPPLF. Among the subsample of banks with positive PPPLF participation, the median level of participation is 17.5%. The two blue bars reflect the subsample of banks that did participate, divided into those above and below the 17.5% median level for participating banks. The results show that conventional SME lending growth increases with prior PPPLF participation.
Figure 2
SME lending growth according to PPPLF participation
Additional sources of differences in persistence of lending
To examine the role of the PPPLF’s assistance in generating the persistent increase in SME lending, we divide small banks by measurable characteristics before the onset of the pandemic. We concentrate on three indicators: liquidity measured by bank cash and security holdings as a share of total assets, capital measured by tier-1 risk-based capital relative to total risk-weighted assets, and the share of tradable assets available for sale in the bank’s securities portfolio. Holding all else equal, increases in bank cash or available-for-sale assets would be associated with an improvement in a bank’s liquidity position. Available-for-sale assets, by construction, are those assets that the bank has not designated to be held to maturity. While tier-1 capital is not directly associated with liquidity, we would expect that banks in lower capital positions would be more reluctant to participate in PPP lending without the ability to use the PPP loans as collateral in raising the funds for this lending. Doing so could have raised the risk that they would face a need to raise capital during the pandemic, which could have been prohibitively costly for banks in low capital positions.
Because the PPPLF was primarily designed to encourage additional PPP lending, these indicators would be expected to increase the impact of PPPLF borrowing on bank SME lending. Banks with less cash, lower capital ratios, and lower shares of tradable assets would probably be more reluctant to increase their lending through the PPP without the ability to use those loans as collateral through the PPPLF.
For each of the three indicators, we split our small bank subsample into two groups for those below median (low) and those above median (high) before the onset of the pandemic. Figure 3 summarizes the estimation results; the full results and more methodological estimation details are available in an online appendix.
Figure 3
Impact of PPPLF and pre-pandemic characteristics
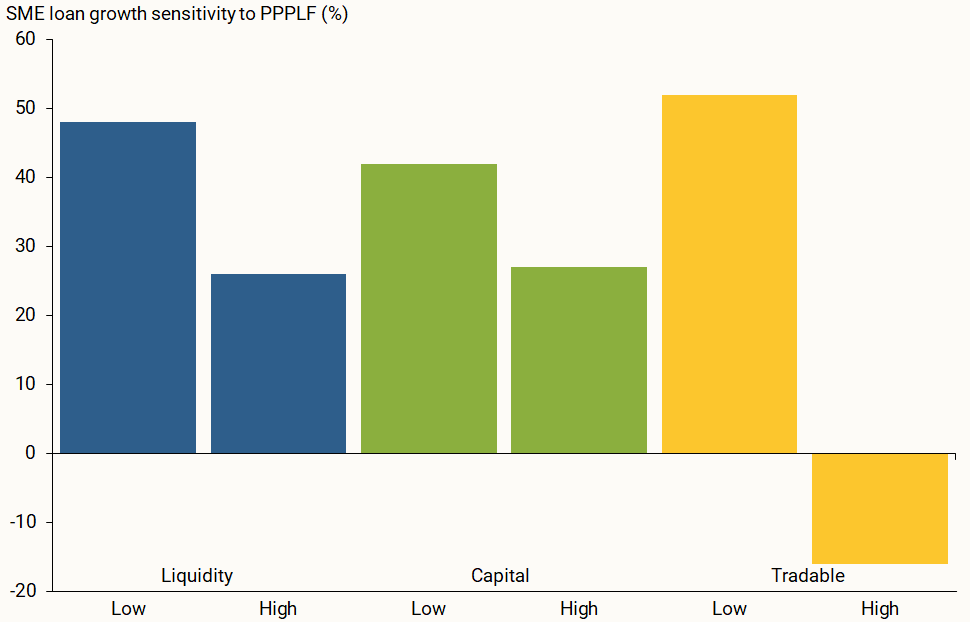
All of the subsample results are consistent with our expectations concerning the relative efficacy of the PPPLF program. We find more impact of the PPPLF program on persistent increases in SME lending among those banks with lower liquidity, lower capital ratios, and lower shares of tradable assets. In contrast, among the subsamples of small banks with higher-than-average capital ratios or tradable assets, the impact of the PPPLF program on persistent SME lending is statistically insignificant.
Conclusion
In this Economic Letter, we revisit the increases in conventional SME lending related to participation in the PPPLF program. Our results confirm that growth in SME lending among banks with lower liquidity was more highly correlated with participation in the PPPLF program.
Our results suggest that persistent SME lending among small banks following collateral incentives from the PPPLF would be greater the less liquid and less capitalized those banks were on average before the program was implemented, holding all else equal. This effect may help to mitigate the apparent long-term scarring in SME lending that followed the pandemic.
References
Anbil, Sriya, Mark Carlson, and Mary-Frances Styczynski. 2023. “The Effect of the Federal Reserve’s Lending Facility on PPP Lending by Commercial Banks.” Journal of Financial Intermediation 55(101042).
Chernenko, Sergey, and David Scharfstein. 2024. “Racial Disparities in the Paycheck Protection Program.” Journal of Financial Economics 160(103911).
Dufresne, Lora, and Mark M. Spiegel. 2025. “Persistent Effects of the Paycheck Protection Program and the PPPLF on Small Business Lending.” FRBSF Working Paper 2024-26.
Granja, João, Christos Makridis, Constantine Yannelis, and Eric Zwick. 2022. “Did the Paycheck Protection Program Hit the Target?” Journal of Financial Economics 145(3), pp. 725–761.
Lopez, Jose A., and Mark M. Spiegel. 2023. “Small Business Lending Under the PPP and PPPLF Programs.” Journal of Financial Intermediation 53(101017).
Opinions expressed in FRBSF Economic Letter do not necessarily reflect the views of the management of the Federal Reserve Bank of San Francisco or of the Board of Governors of the Federal Reserve System. This publication is edited by Anita Todd and Karen Barnes. Permission to reprint portions of articles or whole articles must be obtained in writing. Please send editorial comments and requests for reprint permission to research.library@sf.frb.org