

Some goods and services prices are not directly observed and must be indirectly derived for measuring inflation. This nonmarket-based inflation category has been an important factor keeping headline inflation elevated over the past two years. Because indirectly deriving prices introduces measurement uncertainty, one monetary policy approach would be to focus solely on directly observable prices. Applying this through a well-known monetary policy rule suggests a notably lower federal funds rate. However, other rules that account for the implicit uncertainty that policymakers face would leave the federal funds rate essentially unchanged.
The quality of data available for understanding the U.S. economy has received a lot of attention recently (Leduc, Oliveira, and Paulson 2025). The focus has mainly been on employment data following recent revisions. However, while government statistics remain the benchmark measure, official inflation data are also subject to important measurement challenges.
For most goods and services, the Bureau of Labor Statistics (BLS), the government agency responsible for the consumer price index (CPI), can directly observe prices from sales. But direct pricing information is not readily available for some goods and services. For instance, the prices of some financial services that banks or mutual funds provide might be folded into interest rate spreads or based on the value of assets under management. When this is the case, the BLS must instead indirectly derive, or impute, the prices associated with the goods or services provided, following approaches that are guided by economic theory but are also based on judgment. Such prices are labeled other-than-market or nonmarket-based. Thus, overall inflation measures have a market-based and a nonmarket-based component.
Estimates of current inflation measures, such as those based on the CPI or the personal consumption expenditures (PCE) price index, are inherently subject to measurement noise—it’s impossible to observe all prices in a $31 trillion economy. Using imputed prices for nonmarket-based inflation, which is notably volatile, adds another layer of uncertainty to inflation measurement. An alternative approach would be to focus on market-based inflation as an indicator of overall inflation. This approach would be similar to focusing on core inflation measures, which remove the volatile food and energy components and thus provide better signals of future inflation.
This Economic Letter examines recent movements in nonmarket-based inflation and their contribution to keeping headline inflation elevated. We then use simple monetary policy rules to assess how much removing nonmarket-based inflation would affect the current federal funds rate. We find that using one well-known rule would prescribe lowering the federal funds rate about 40 basis points (0.4 percentage point). However, rules that account for an uncertain environment would suggest a much smaller policy rate adjustments of around 10 to 14 basis points on average.
Measuring nonmarket-based inflation
To measure CPI inflation, the BLS collects prices for approximately 80,000 goods and services in 75 urban areas across the country (BLS 2025). The Bureau of Economic Analysis (BEA) produces its PCE price index and related measures using BLS price indexes and other data sources. CPI price indexes account for more than 70% of the share of nominal PCE.
However, for a subset of goods and services, no prices are explicitly paid for the good a business sells or a service it provides. In such cases, the BEA imputes the prices based on economic theory, informed judgment, and numeric assumptions derived from other data sources, including the BLS’s producer price index (PPI).
The share of nonmarket-based goods and services in overall inflation is meaningful and has risen slowly over time, from below 10% of total PCE in the late 1980s to about 14% today. Conversely, market-based components have fallen below their pre-pandemic historic average share to a low of about 86% as a share of overall PCE, and even lower as a share of core PCE.
Historically, nonmarket-based inflation has mostly been higher and more volatile than market-based inflation (Figure 1). Over the last three years, 12-month nonmarket-based PCE inflation has mostly remained above 4%.
Figure 1
Market vs. nonmarket PCE inflation
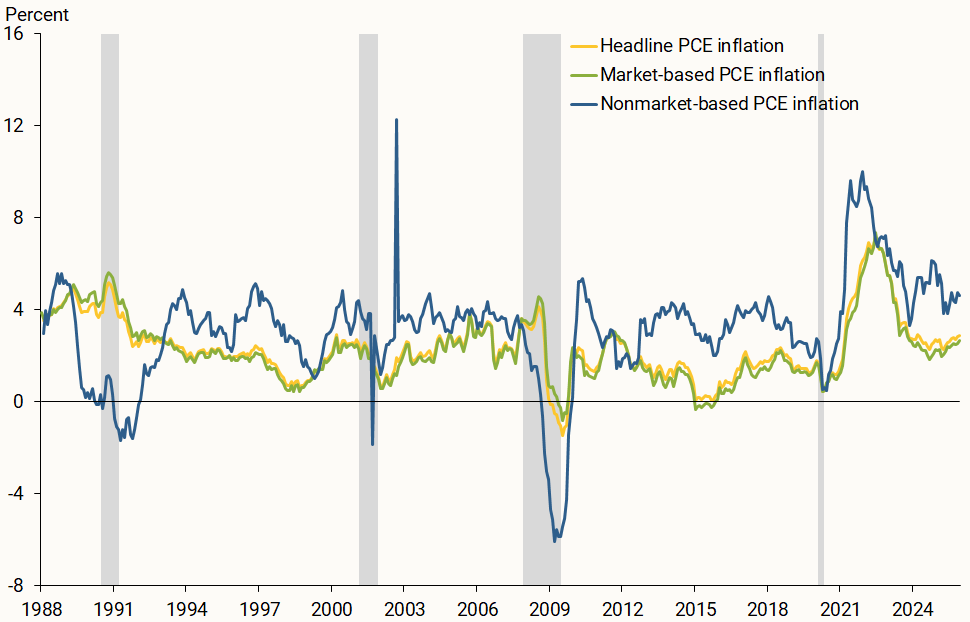
Source: Bureau of Economic Analysis and authors’ calculations.
Notably, nonmarket-based inflation remains above its pre-pandemic average and has contributed about 0.7 percentage point to headline inflation on average over the past two years (Figure 2). The pre-pandemic average contribution between 1988 and 2019 was less than half that, at 0.3 percentage point. Therefore, understanding what is keeping nonmarket-based inflation elevated may provide additional information regarding the future evolution of inflation.
Figure 2
Market vs. nonmarket contributions to PCE inflation
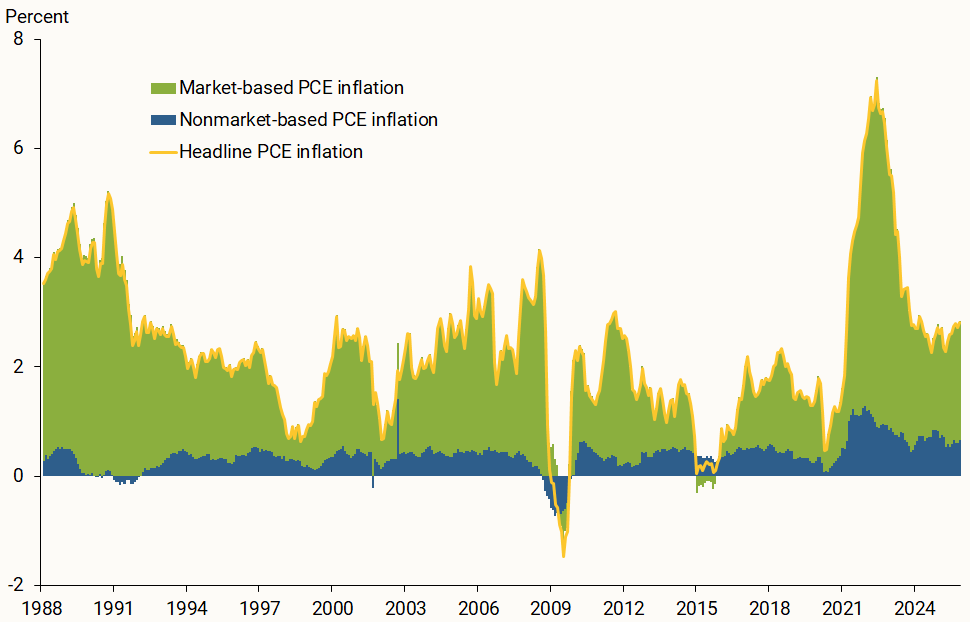
Source: Bureau of Economic Analysis and authors’ calculations.
Drilling down into nonmarket-based inflation
For nearly 40 years, financial services and insurance have generally been the largest contributors to nonmarket-based PCE inflation. Within financial services, the contribution from portfolio management charges has been particularly large in recent years, accounting for roughly 43% of financial services inflation since 2024.
This higher share accentuates the impact of stock prices on nonmarket-based and headline PCE inflation. This is because the underlying approach to measuring prices for portfolio management services introduces a strong relationship between stock price fluctuations and nonmarket-based PCE inflation, which ultimately feeds into headline PCE inflation. In the BLS methodology, a direct price is often not specified when investors receive advice from portfolio management firms. Instead, the charge for this service may be covered by management fees, which the BLS uses as a proxy for prices. Since these fees are usually based on a percentage of the value of assets under management, the approach introduces a strong correlation between stock price changes and portfolio management services inflation (Figure 3). Moreover, the booming stock market in recent years has directly kept inflation in portfolio management services higher than it typically is.
Figure 3
Portfolio management inflation and stock markets
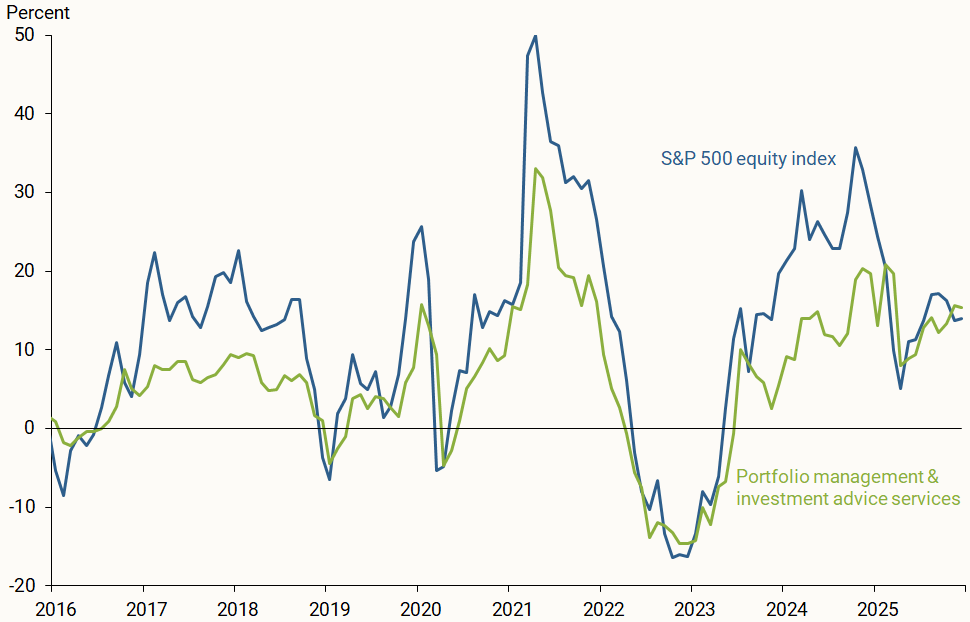
Source: Standard & Poor’s, Bureau of Economic Analysis, and authors’ calculations.
Market-based inflation and monetary policy
Imputing nonmarket-based inflation introduces measurement uncertainty. While any price index measure includes some noise, the nonmarket-based category may cloud the signal that current price pressures send about future inflation (Miran 2025). This is important because monetary policy impacts the economy with a lag, such that policymakers must base policy decisions in part on economic forecasts.
Thus, we examine how much disregarding nonmarket-based PCE inflation would alter the monetary policy stance. To do so, we first consider simple monetary policy rules that are often used as guides in setting the policy interest rate; see, for instance, the latest publicly available forecast documents (Board of Governors of the Federal Reserve System 2020).
Monetary policy rules determine the level of the federal funds rate as a function of economic conditions. We consider two rules. First, we examine a forward-looking Taylor rule that assumes the federal funds rate is set as a function of expected inflation deviations from the 2% target rate and of expected unemployment gaps. The unemployment gap is measured as the difference between the unemployment rate and its long-run value, which serves as a proxy for where the unemployment rate would settle once shocks to the economy dissipate. The unemployment gap provides a measure of the economy’s strength.
We also consider an inertial version of the forward-looking Taylor rule. This rule is called inertial because it implies that the policy rate is highly autocorrelated over time, by design. As a result of this inertia, the rule implies that the policy rate responds less to expected economic conditions, thus it can also be interpreted as implicitly capturing the uncertainty that policymakers face. An alternative interpretation is that policymakers want to smooth interest -rate volatility, possibly for financial stability reasons.
The federal funds rate varies systematically with changes in expected economic conditions, thus monetary policy rules induce predictability. However, as policy benchmarks, monetary policy rules have important limitations. For instance, because of their simplicity, they necessarily disregard many important features of the economy that policymakers must consider in setting the policy rate.
We also consider an alternative approach using the methodology in Barnichon and Mesters (2023), which calculates the monetary policy path that would best achieve the Federal Reserve’s dual mandate of maximum employment and price stability, given expectations for future headline inflation and future unemployment gaps. This methodology is based on the empirical effects that a change in the federal funds rate has on inflation and economic activity. Their work is the basis for the Policy Calibration Tool (PCT), now available on the San Francisco Fed’s website.
For this study, we use the March 2026 median projections from the Summary of Economic Projections that Federal Open Market Committee participants submit four times a year. We use the projections for headline PCE inflation and the unemployment rate as inputs into the PCT. Guided by the difference between the average headline and market-based inflation rates since 2020, we simulate the removal of nonmarket-based inflation by lowering headline inflation forecasts 0.3 percentage point, implicitly assuming that market-based inflation provides a perfect signal for future headline inflation.
Figure 4 shows that, for the forward-looking Taylor rule, focusing on market-based inflation would lower the policy rate about 40 basis points (0.4 percentage point). However, the policy rate would fall only about 10 to 14 basis points under the inertial rule or under the PCT, on average, over three-year forecasts. This is because, empirically, monetary policy under the PCT behaves similarly to that under an inertial rule. One interpretation is that, once the uncertainty surrounding the economy is implicitly taken into account, focusing on market-based inflation would lead to only small policy adjustments, since policymakers guided by inertial rules would be reluctant to make large changes in the policy rate in this case.
Figure 4
Policy rate gap implied by interest rate rules
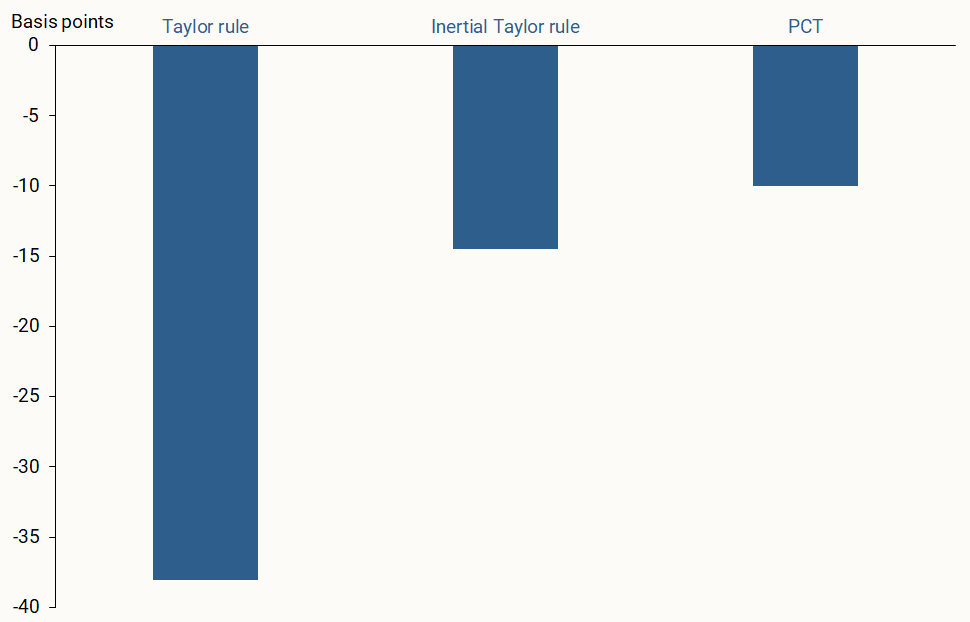
adjusted 12-month inflation rates.
Source: SF Fed’s Policy Calibration Tool, Bureau of Economic Analysis, Congressional Budget Office, and authors’ calculations.
Finally, we stress that these numbers are upper bounds, since they assume that market-based inflation provides a perfect signal about future headline inflation. However, empirically, the quality of this signal is roughly the same as that from frequently used core inflation measures (Verbrugge and Zaman 2025), and so it is not a perfect guide.
Conclusion
This Letter examines how, over the past two years, nonmarket components have represented a slowly rising share of PCE, while nonmarket-based inflation has been contributing more than double its historical pre-pandemic average to headline PCE inflation. Because imputing prices that cannot be directly observed introduces uncertainty in inflation measures, one approach to monetary policy would be to focus on prices that are directly observed. Under a well-known monetary policy rule, such an approach suggests a notably lower federal funds rate. However, approaches that implicitly account for the uncertainty that policymakers face would leave the federal funds rate essentially unchanged.
References
Barnichon, Regis, and Geert Mesters. 2023. “A Sufficient Statistics Approach for Macro Policy.” American Economic Review 113(11, November), pp. 2,809–2,845.
Board of Governors of the Federal Reserve System. 2020. “Report to the FOMC on Economic Conditions and Monetary Policy.” Tealbook A, December 4 (modified January 16, 2026).
Bureau of Labor Statistics. 2025. “Consumer Price Index: Overview.” Handbook of Methods, January 30.
Leduc, Sylvain, Luiz E. Oliveira, and Caroline Paulson. 2025. “Do Low Survey Response Rates Threaten Data Dependence.” FRBSF Economic Letter 2025-07 (March 31, 2025).
Miran, Stephen I. 2025. “The Inflation Outlook.” Speech at the School of International and Public Affairs, Columbia University, New York, New York, December 15.
Verbrugge, Randall, and Saeed Zaman. 2025. “Understanding Inflation via Developments in Market and Nonmarket Inflation Rates.” FRB Cleveland, Economic Commentary EC2025-09 (September 22).
Opinions expressed in FRBSF Economic Letter do not necessarily reflect the views of the management of the Federal Reserve Bank of San Francisco or of the Board of Governors of the Federal Reserve System. This publication is edited by Anita Todd and Karen Barnes. Permission to reprint portions of articles or whole articles must be obtained in writing. Please send editorial comments and requests for reprint permission to research.library@sf.frb.org