
The artificial intelligence boom has coincided with unusually high stock valuations, echoing earlier technology-driven booms. Four economic variables can largely account for changes in the stock market’s cyclically adjusted price-earnings ratio since 1961, including most of the run-up since 2022. The most important of these is the noncyclical rate of unemployment, which points to a connection between the stock market and the labor market. This may reflect that employers value the future benefits from hiring new workers in much the same way that investors value future cash flows from stocks.
The artificial intelligence (AI) boom shares features with other technology-driven booms throughout history. These include a “new era” narrative, surging investment in the affected sectors, and elevated values of the cyclically adjusted price-earnings (CAPE) ratio, a metric that can help judge whether the stock market is overvalued. The CAPE ratio is computed as the real, or inflation-adjusted, value of the Standard and Poor’s (S&P) 500 stock price index divided by the real earnings of the companies in the index, averaged over the most recent 10 years. An elevated CAPE ratio raises a longstanding and recurring question: Are stock prices justified by fundamentals, or are investors overreacting to a new technology?
In this Economic Letter, we examine whether fundamental macroeconomic variables can explain movements in the CAPE ratio. We consider four such variables: the neutral real rate of interest (r-star), the growth rate of potential output (g-star), the noncyclical rate of unemployment (u-star), and an index of macroeconomic uncertainty. We use a simple model to estimate how well these variables account for movements in the CAPE ratio since 1961, including the recent AI-driven run-up. The most important explanatory variable is u-star, which gauges the longer-term health of the labor market after short-term shocks have dissipated. A decline in u-star tends to coincide with a higher CAPE ratio, allowing the model to account for most of the run-up in the CAPE ratio since late 2022. Without u-star, the model implies a much lower CAPE ratio during this period. One way to explain the connection between the stock market and the labor market, as Hall (2017) describes, is that employers value the future benefits from hiring new workers in much the same way that investors value future cash flows from stocks.
The CAPE ratio and new eras
Major stock price run-ups have generally coincided with the emergence of some new era narrative centered on the introduction of a new technology (Lansing 2008).
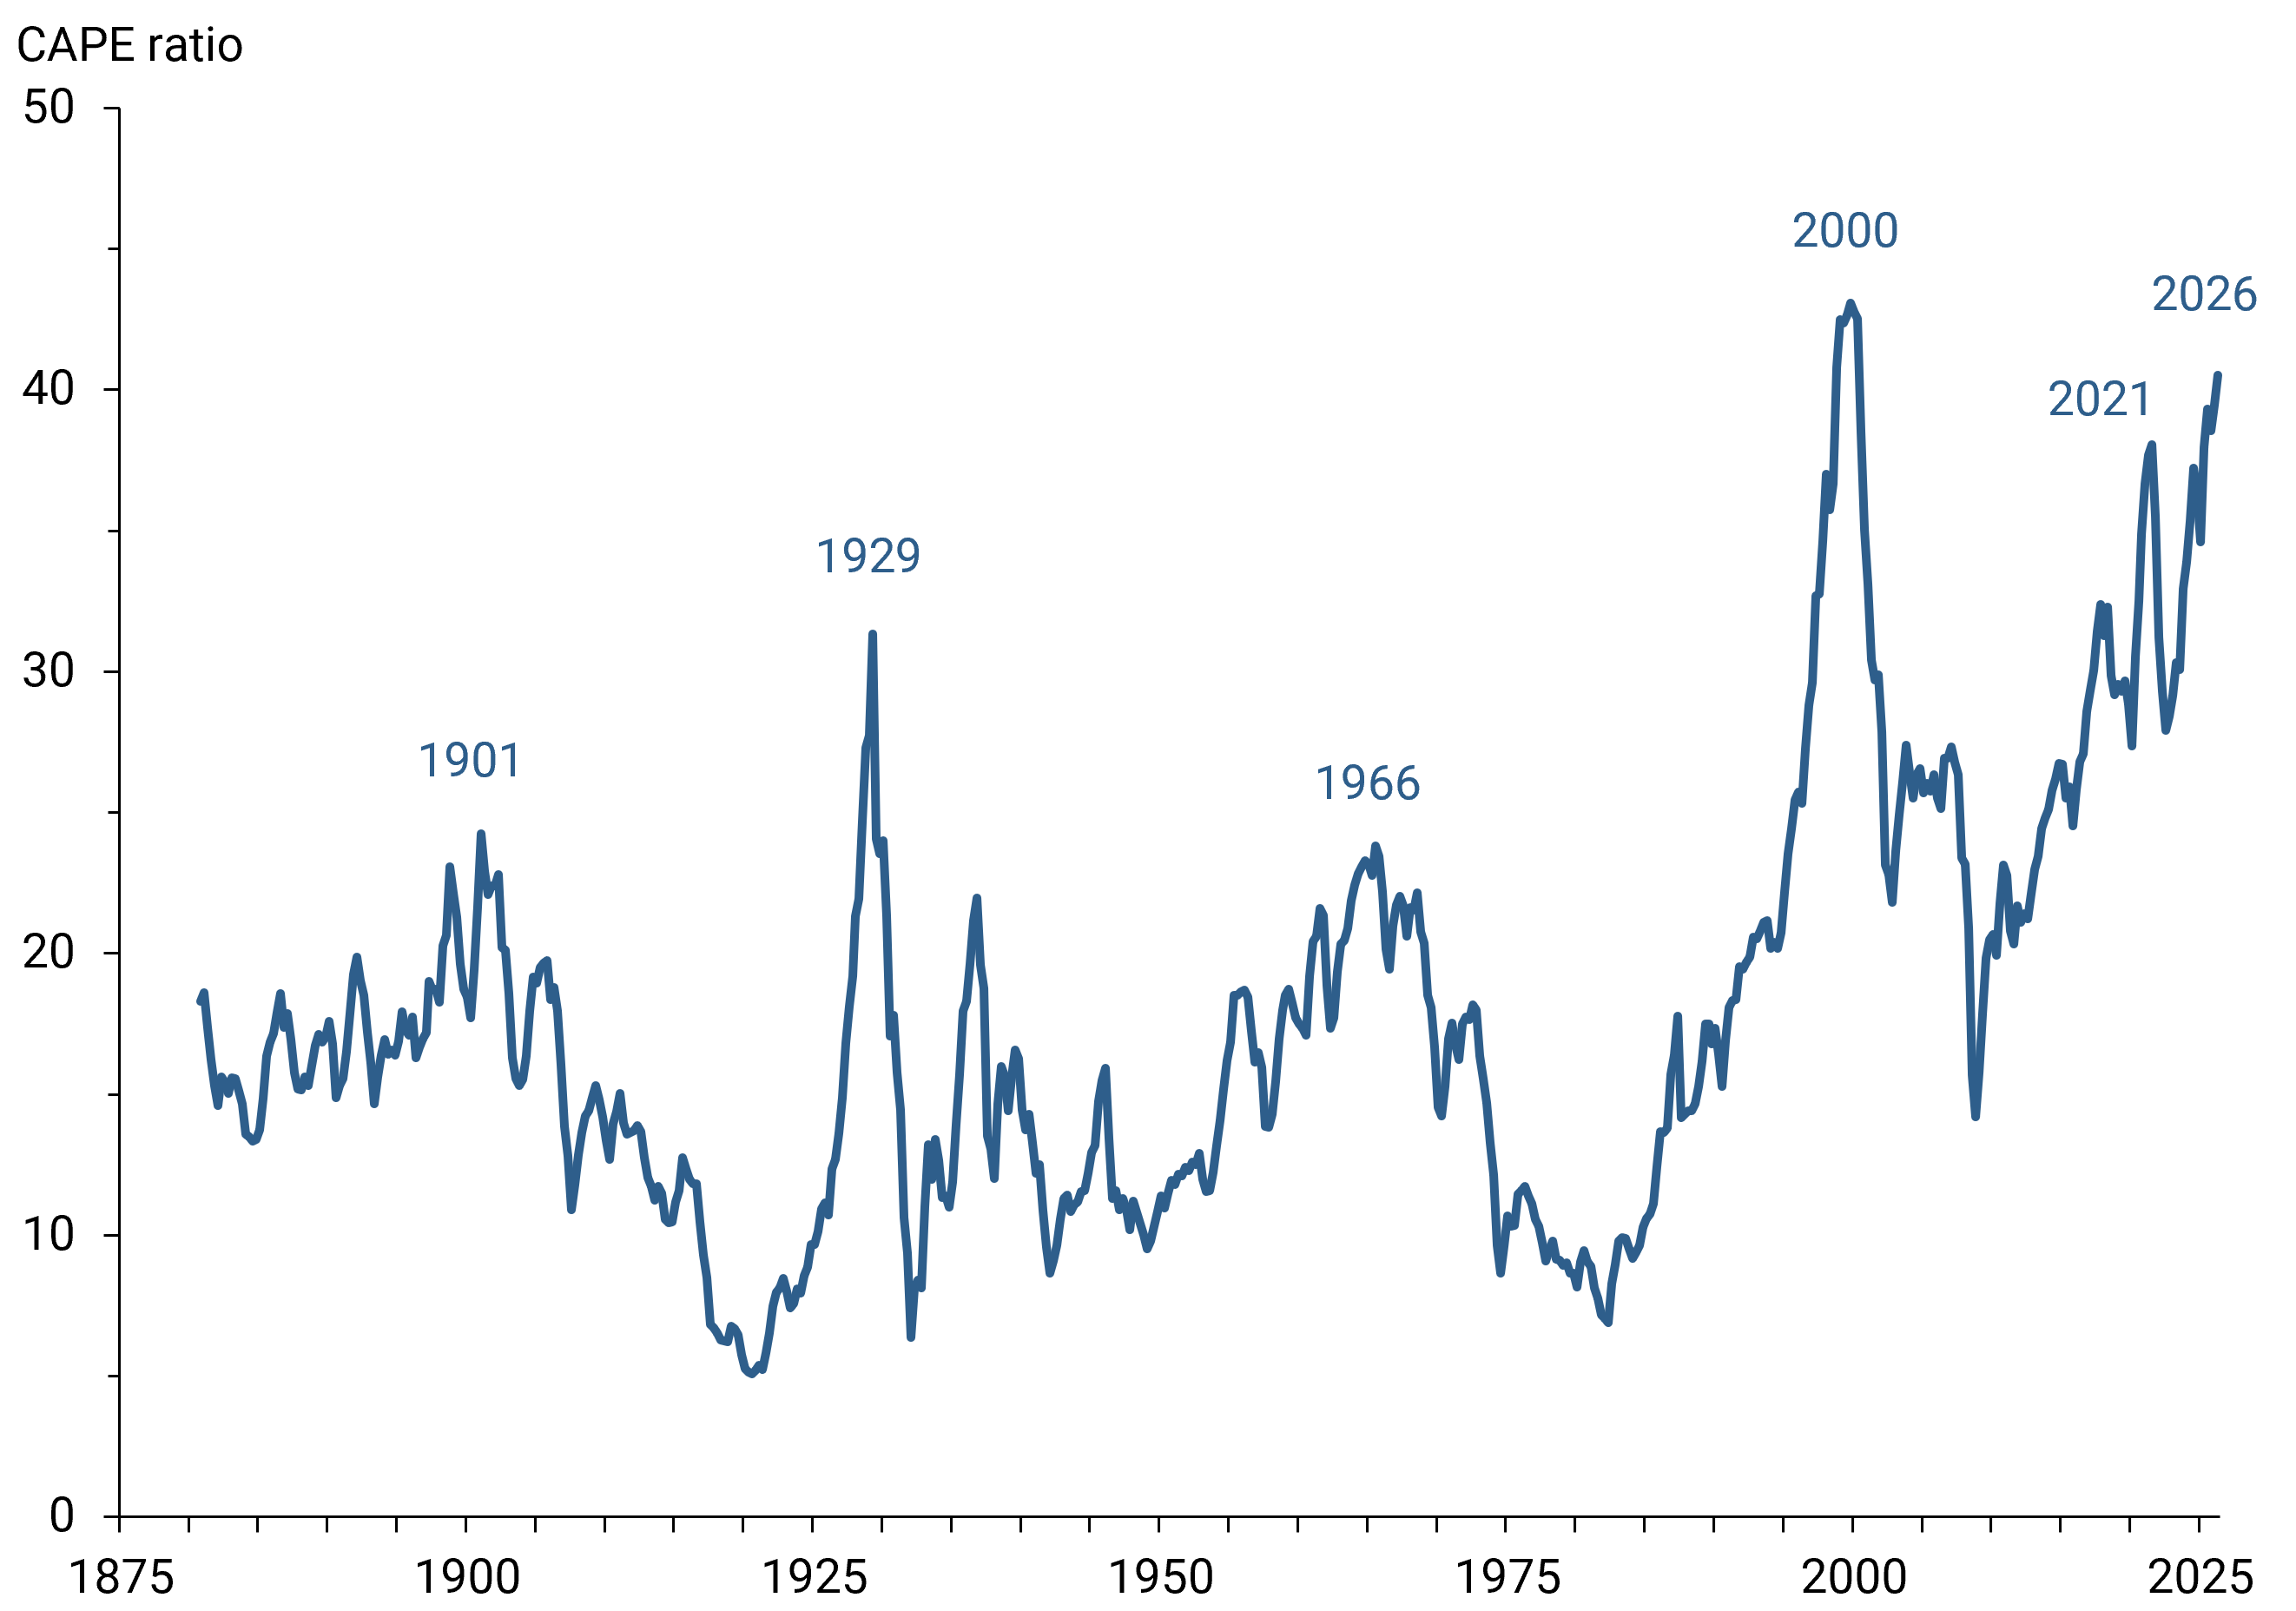
Figure 1 shows six such run-ups in the CAPE ratio since the late 1800s. The first four reflect investor enthusiasm for railroads and electricity (early 1900s), automobiles and radio (late 1920s), semiconductors and television (1950s and 60s), and the internet (late 1990s). The fifth, peaking in late 2021, coincided with the spread of social networks, cloud computing, and electric cars. The most recent run-up can be linked to AI, starting with the release of ChatGPT in November 2022.
Figure 1
Cyclically adjusted price earnings (CAPE) ratio
The CAPE ratio and macroeconomic variables
As of the third quarter of 2026, the CAPE ratio stood at 40.5. This is higher than all but one of the five prior peaks shown in Figure 1, the exception being the 43.1 peak in the first quarter of 2000. To assess whether the current CAPE ratio signals overvaluation, we examine how much of the ratio can be explained by a model based on fundamental macroeconomic variables.
In theory, the fundamental stock price is the present value of expected future cash flows that accrue to shareholders. The discount rate used to calculate the present value combines a risk-free rate of return and a risk premium tied to uncertainty about future cash flows. A lower risk-free rate or less uncertainty means that future cash flows are discounted less, raising the fundamental price. The expected growth rate of future cash flows matters as well, with faster growth implying a higher price. One measure of the risk-free rate of return is the neutral, or natural, real rate of interest, known as r-star. Standard economic models link r-star to households’ degree of patience, which influences their willingness to save, and to the expected growth rate of potential output, or g-star, which shapes the return from saving. The same models imply that g-star influences the growth rate of real cash flows from stocks.
Evidence from Hall (2017) shows that movements in the stock market and the labor market are connected. One explanation is that both reflect the present value of expected future payoffs from some action. In the stock market, investors value the expected future cash flows from buying stocks. In the labor market, employers value the expected future benefits from hiring new workers. A decline in the discount rate raises the present value of both payoff streams, contributing to higher stock prices and stronger hiring, with the latter pushing down unemployment in general and u-star in the longer-run. The two markets may also be linked through improvements in job-matching efficiency that pair workers and employers more effectively, boosting worker productivity and the profitability of publicly traded firms.
Figure 2 plots the CAPE ratio together with the four macroeconomic explanatory variables. The r-star series is the two-sided estimate from Laubach and Williams (2016, updated). The g-star series is the four-quarter growth rate of real potential output constructed by the Congressional Budget Office (CBO). The u-star series is the noncyclical rate of unemployment, also from the CBO. The macroeconomic uncertainty index, from Jurado, Ludvigson, and Ng (2015, updated), summarizes the magnitude of forecast errors when a statistical model of the U.S. economy is used to project the 12-month-ahead values of a large group of macroeconomic variables.
Figure 2
CAPE ratio and macroeconomic explanatory variables
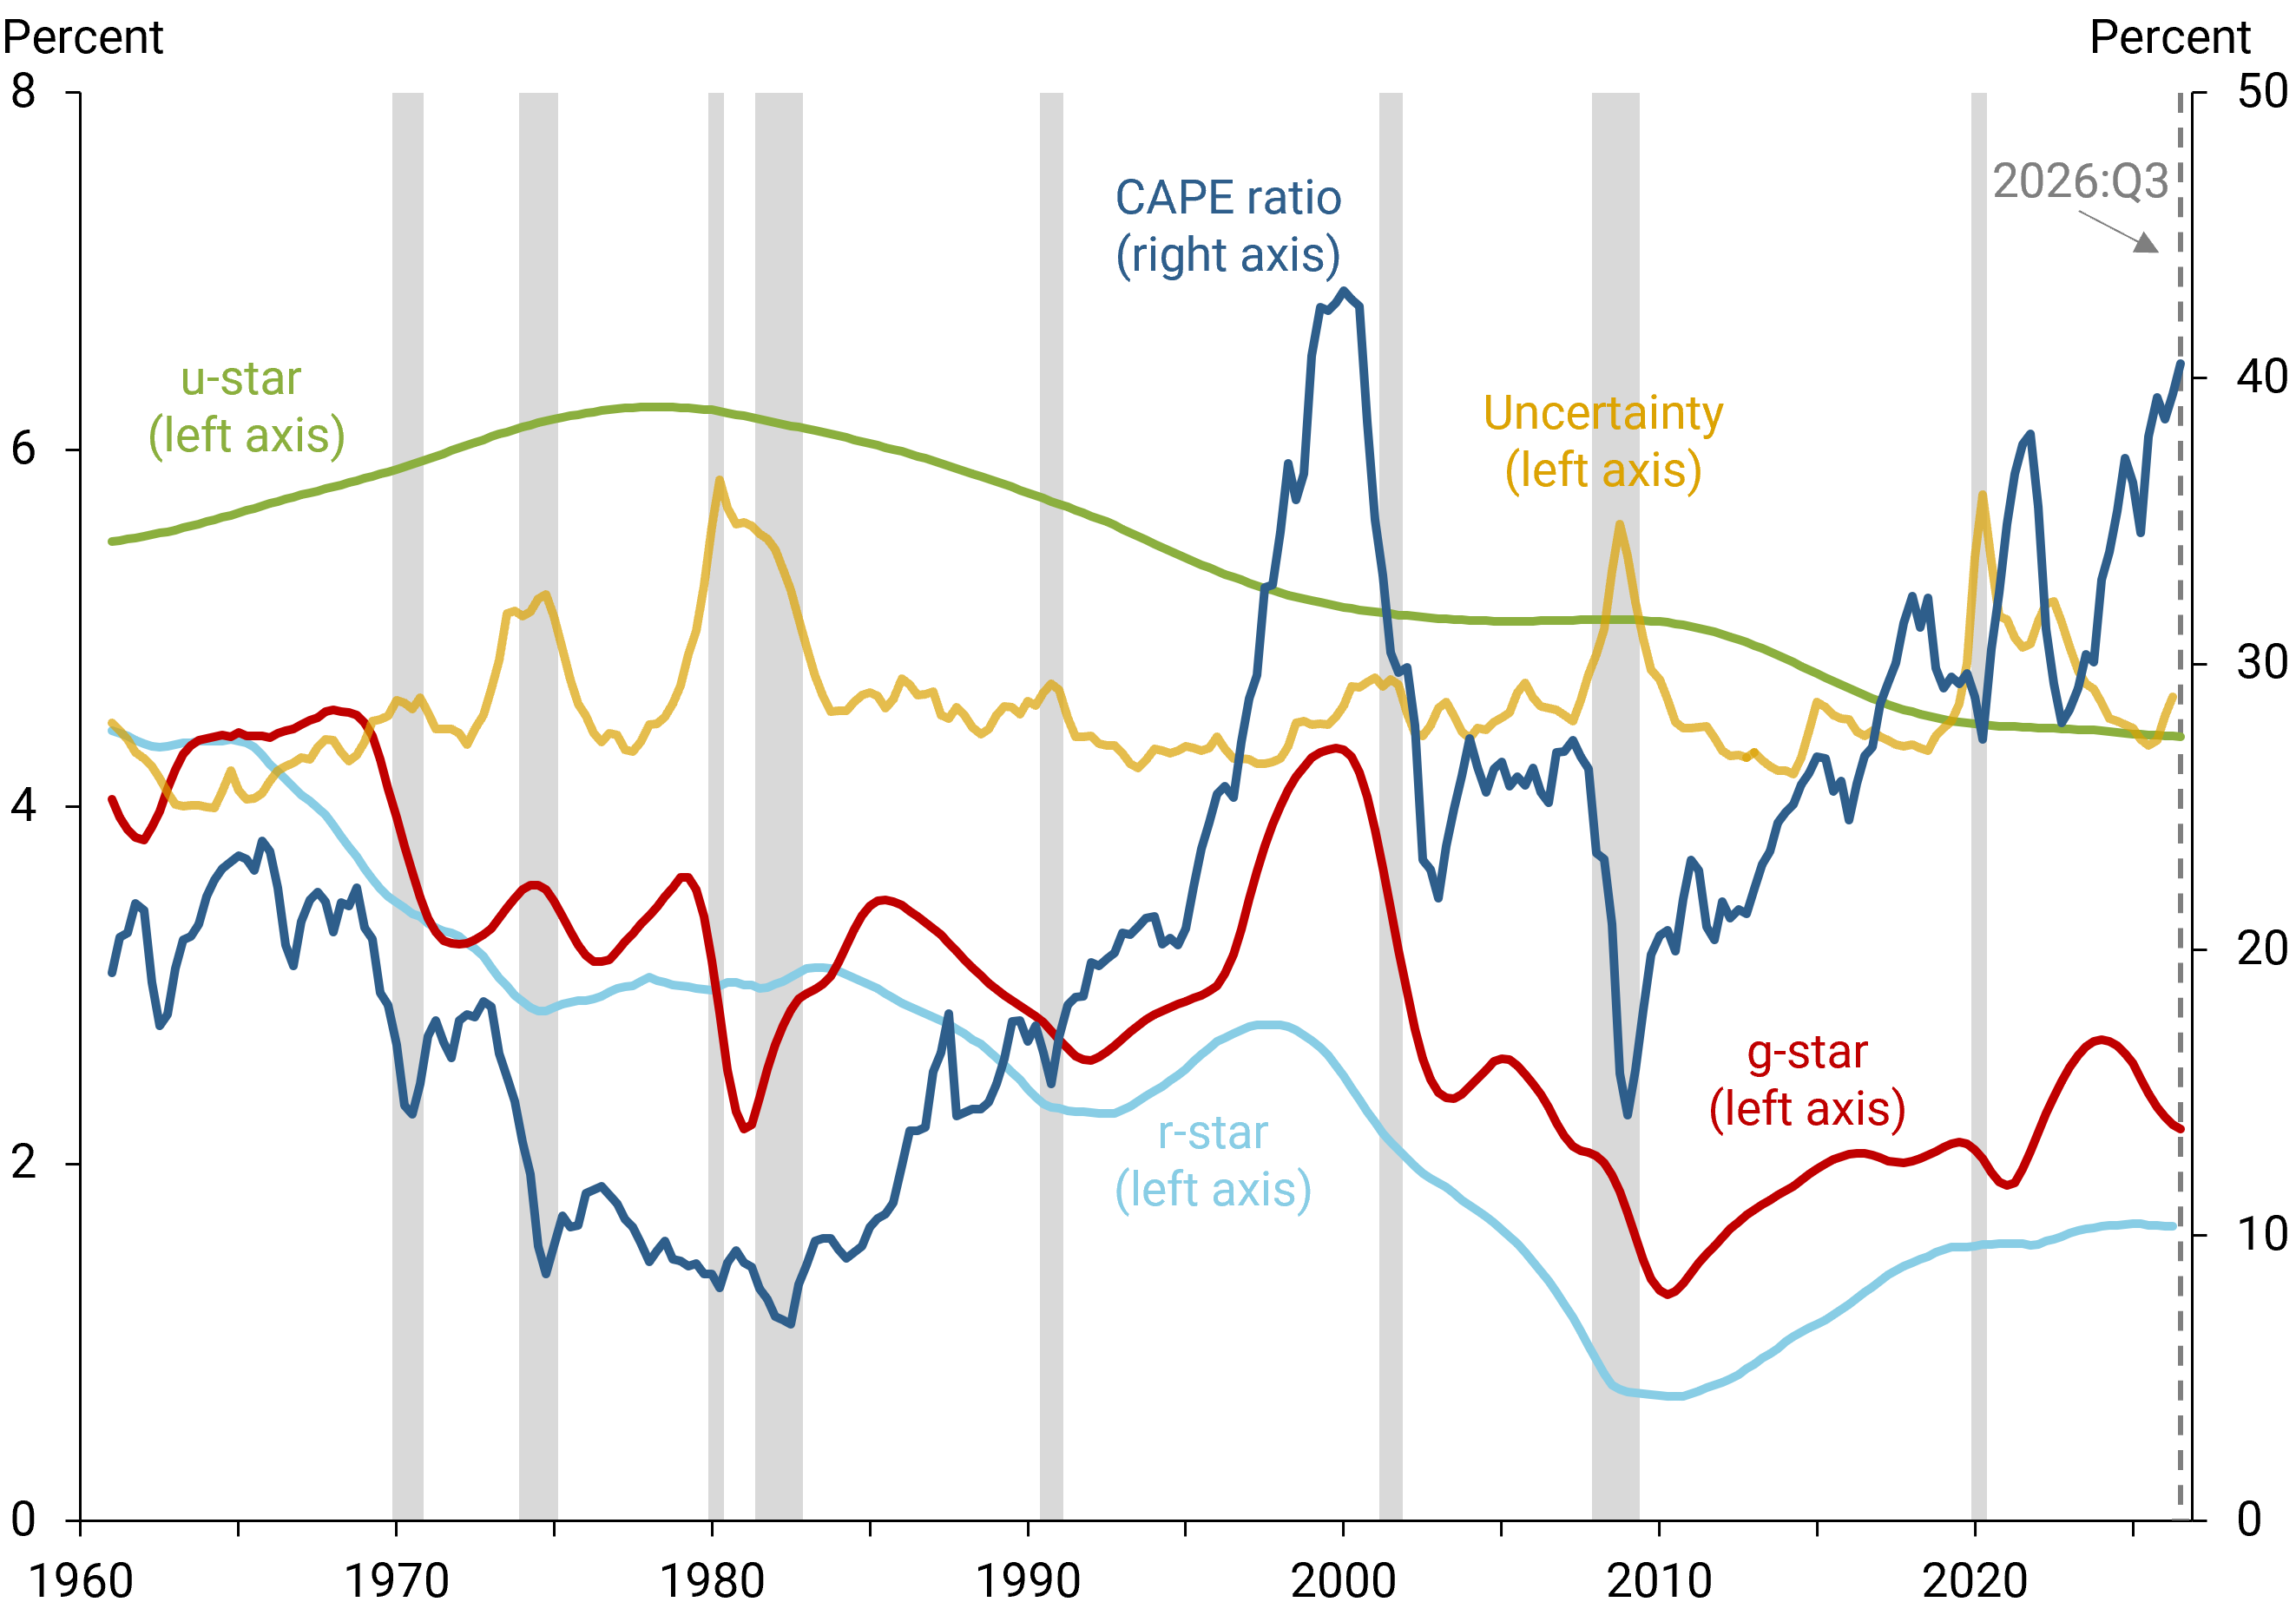
The CAPE ratio trends mostly downward before 1980 and mostly upward thereafter. The u-star series exhibits the opposite pattern, rising before 1980 and declining thereafter. The r-star and g-star series both exhibit downward-sloping trends, but the decline in r-star is more pronounced. The uncertainty index tends to be high during recessions (gray bars) but then declines during recoveries.
Actual versus fitted values for the CAPE ratio
We use a simple regression model to examine how well the macroeconomic variables can explain movements in the CAPE ratio. The model estimates the numerical coefficients that link the quarterly average CAPE ratio, measured in logarithms, to a constant, the three star variables, and the uncertainty index. We use data from 1961 through the third quarter of 2026. Each macroeconomic variable is lagged by one quarter relative to the CAPE ratio to overcome data availability issues at the end of the sample.
All four macroeconomic variables are statistically significant in accounting for historical movements in the CAPE ratio. Consistent with theory, the estimated coefficients on r-star, u-star, and the uncertainty index are negative, while the estimated coefficient on g-star is positive. The in-sample fit is excellent, accounting for 89% of the variance in the CAPE ratio. The most important explanatory variable is u-star. Estimated without u-star, the model accounts for only 49% of the variance in the CAPE ratio.
Figure 3 plots the actual versus fitted (model-implied) values of the CAPE ratio, both with and without u-star included in the model. For charting purposes, we convert the fitted values in logarithms into equivalent values for the CAPE ratio itself. Both versions of the model yield fitted values below the actual ratio during the late 1990s internet boom, suggesting that the stock market was overvalued during this episode. Both versions also predict sharp drops in the CAPE ratio during the 2008–2009 financial crisis, a period of high uncertainty.
Figure 3
Actual versus fitted values of the CAPE ratio
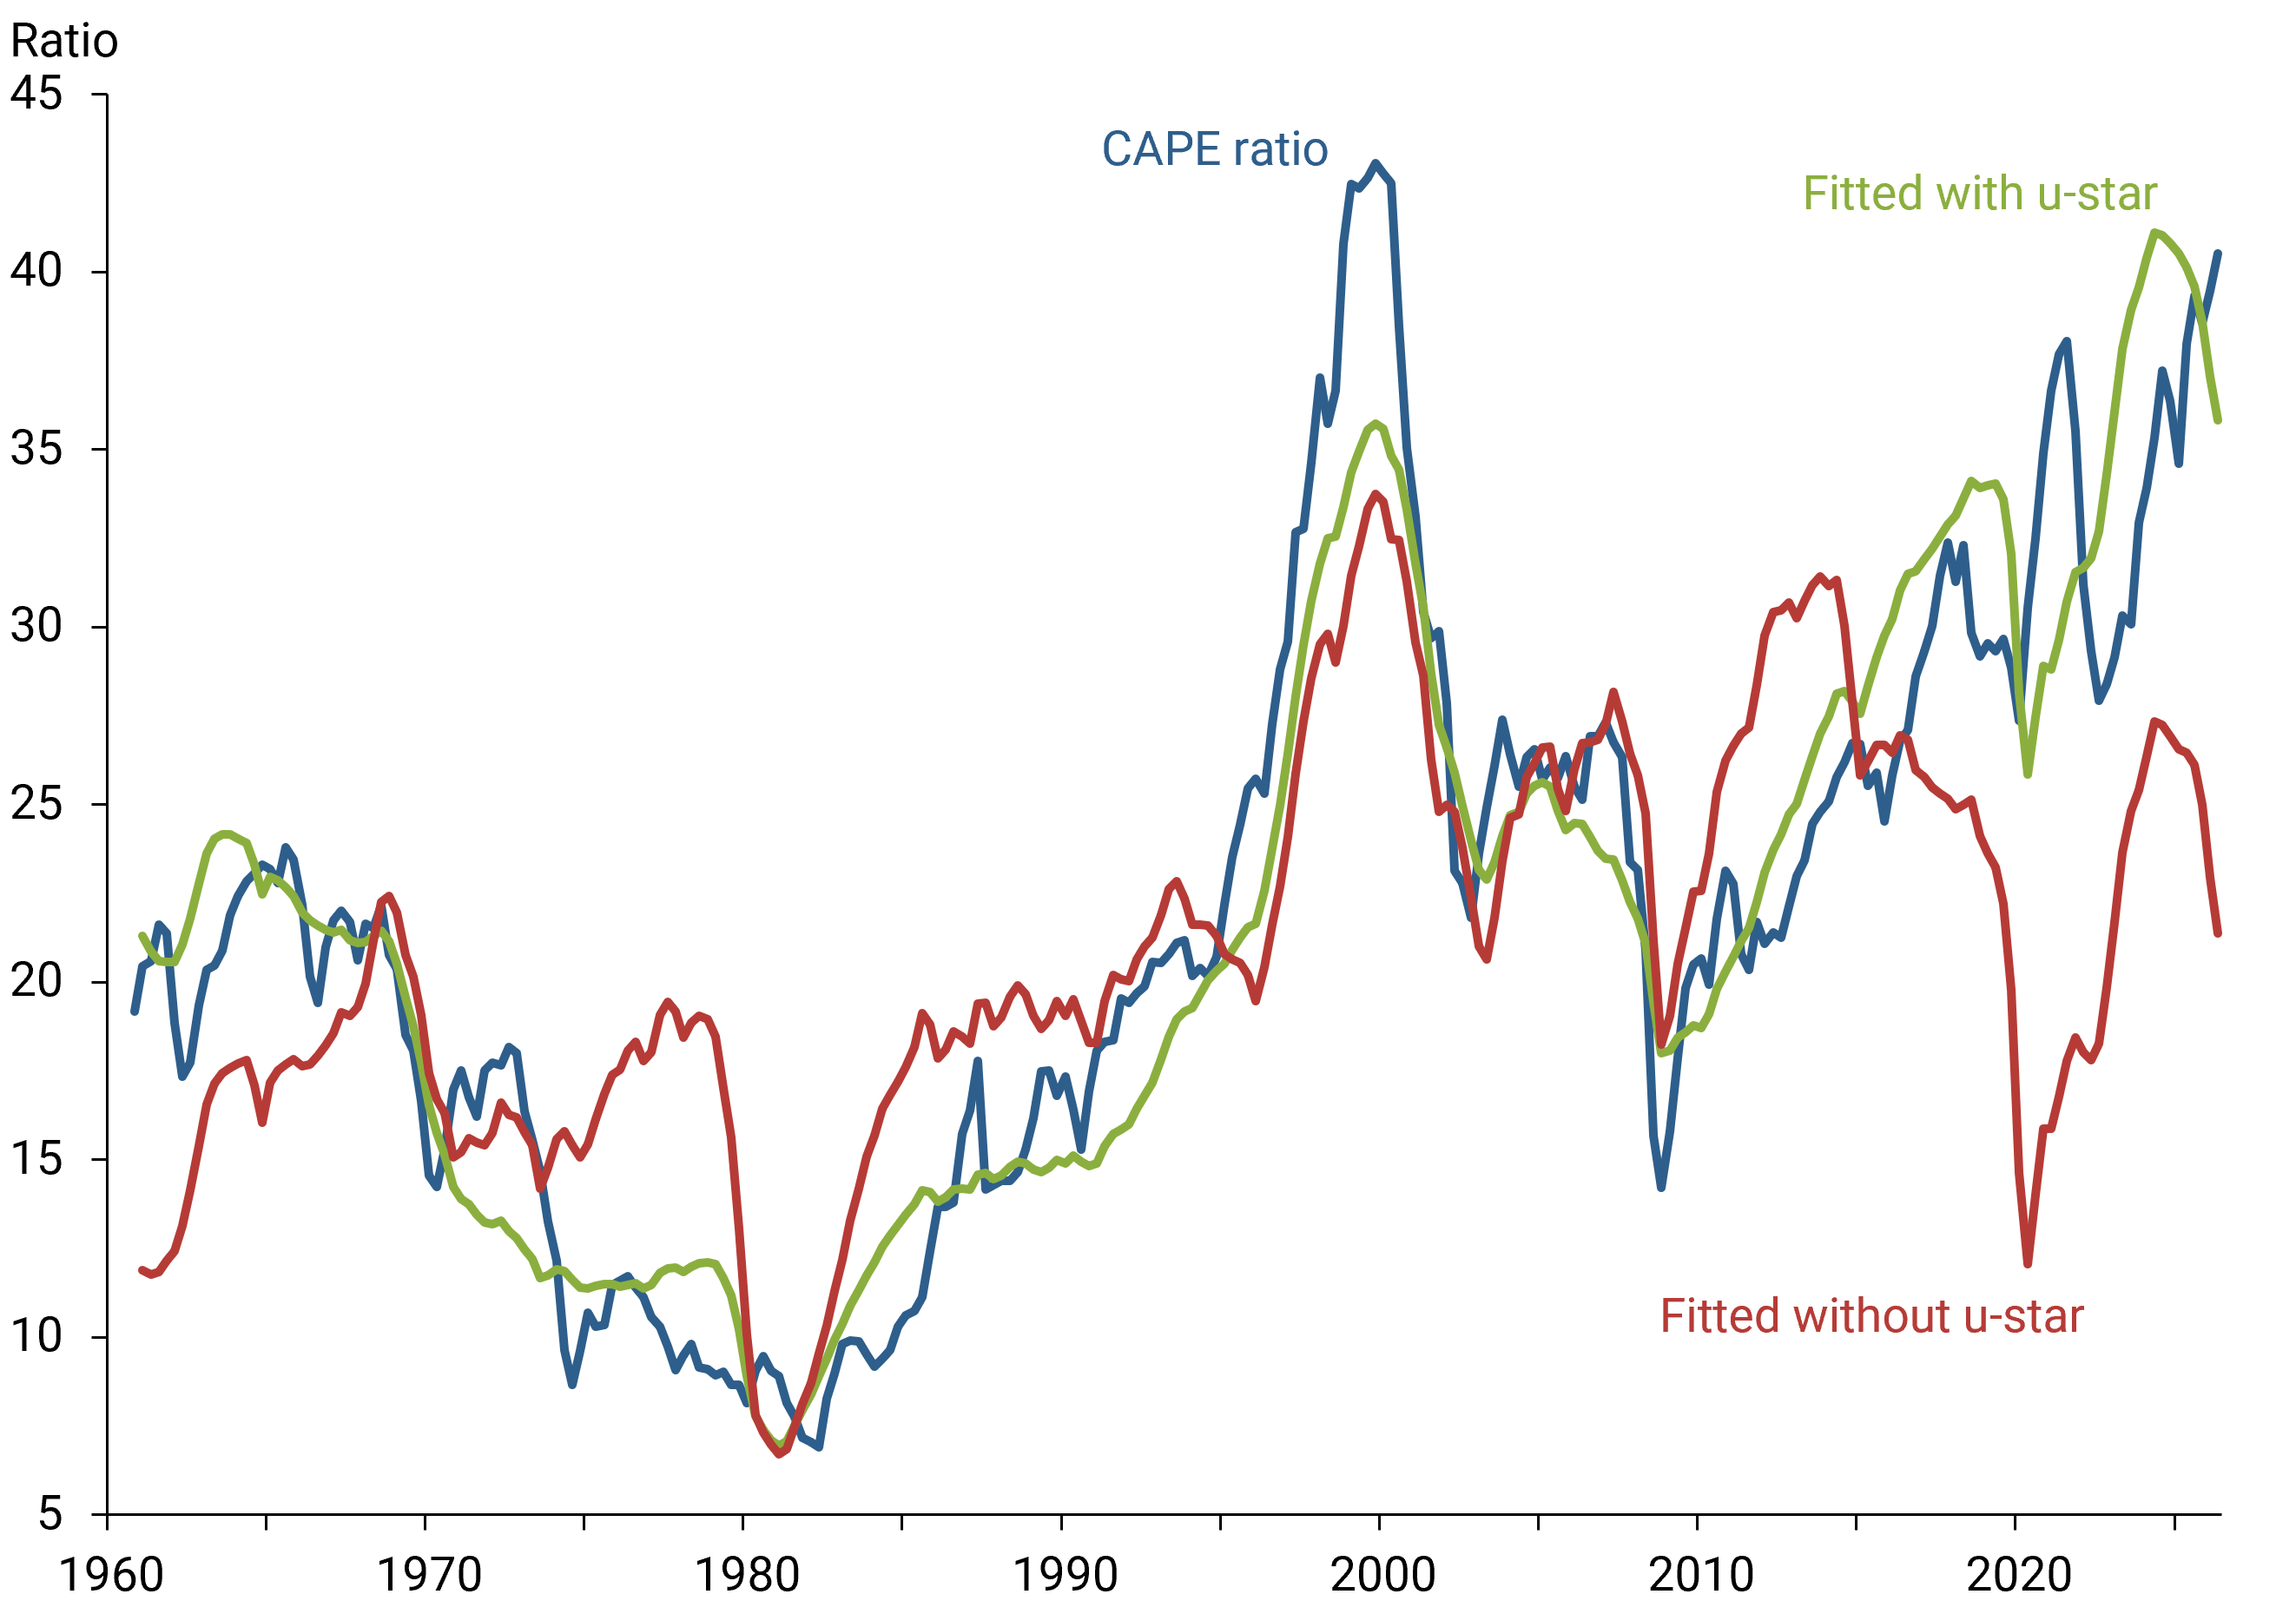
The model with u-star fits the actual CAPE ratio quite well from 2010 to 2026, including the transitory decline in early 2020 during the pandemic recession. In contrast, the model without u-star predicts a much different trajectory for the CAPE ratio after 2010, including an exceptionally large decline in early 2020. The latter occurs because that model version attributes a larger share of CAPE ratio movements to changes in uncertainty. But the uncertainty rise during the pandemic recession had a much smaller impact on stock market valuation than the comparable uncertainty rise observed during the 2008–2009 financial crisis, as Lansing (2020) discusses. The large gap between the two fitted trajectories after 2010 shows that assessments of fundamental stock market value can be highly sensitive to the details of the underlying model.
In the third quarter of 2026, the model with u-star yields a fitted CAPE ratio of 35.8, which is 11.6% below the actual ratio of 40.5. In contrast, the model without u-star yields a fitted CAPE ratio of 21.4, representing a 47.2% drop from the actual ratio.
The CAPE ratio and labor’s share of income
The decline in labor’s share of U.S. national income has been the most important driver of rising stock market valuations since the late 1980s according to Greenwald, Lettau, and Ludvigson (2025). A lower labor share implies that a larger fraction of national income accrues to capital owners, including shareholders, rather than workers. Proposed explanations include the rise of automation and the gradual erosion of workers’ bargaining power.
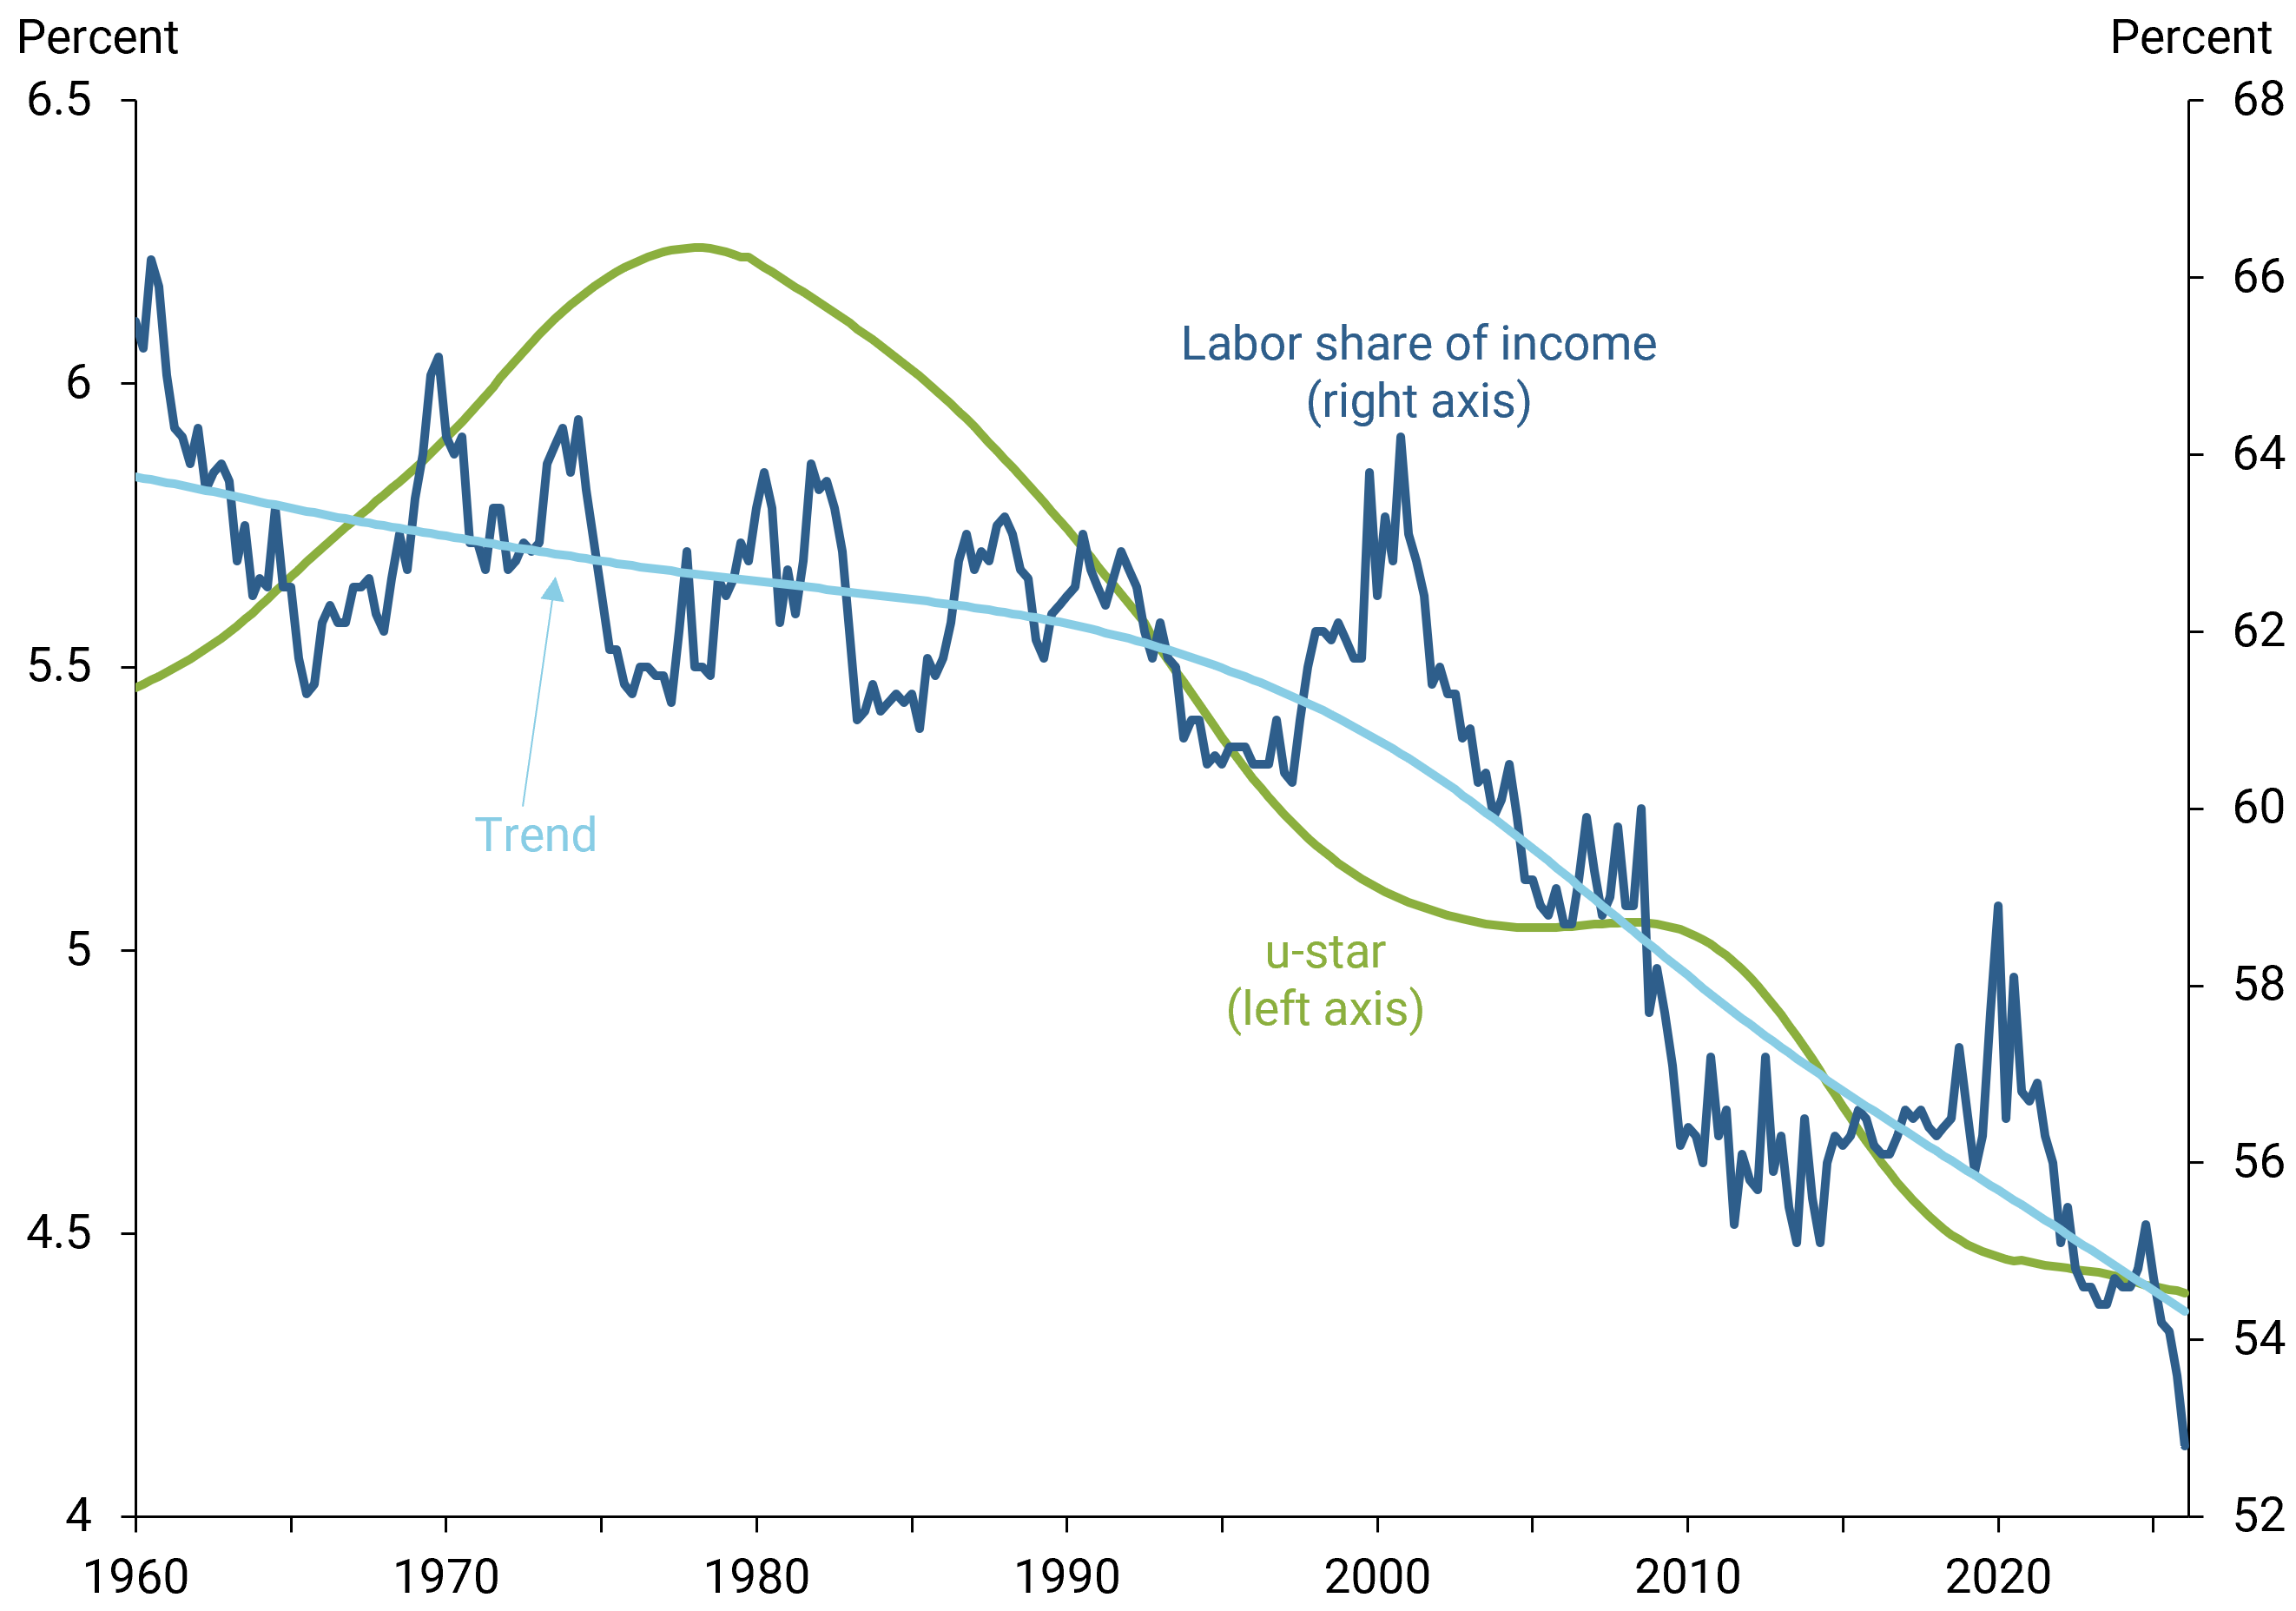
Figure 4 shows the U.S. labor share of income from the Bureau of Labor Statistics together with u-star. The labor share trends downward over the sample, with the decline becoming steeper around the early 1990s. Replacing u-star with the labor share trend in our regression model yields a negative and highly significant coefficient. However, this model version explains only 71% of the variance in the CAPE ratio, compared with 89% for the model with u-star. The u-star model fits better in part because of the pre-1980 period, when u-star was rising while the CAPE ratio was declining. After 1980, the downward trends observed in u-star and the labor share suggest that both variables may be responding to common structural forces that are reshaping the labor market.
Figure 4
Labor share of income versus u-star
Conclusion
This Letter shows that a model built on four macroeconomic variables can largely account for movements in the CAPE ratio since 1961, including most of the recent run-up linked to investor enthusiasm for AI. But the model’s ability to fit the historical data does not guarantee that the current CAPE ratio of 40.5 is sustainable. While grounded in economic theory, the historical relationships captured by the model may change. Previous technology-driven booms were accompanied by “this time is different” narratives that sought to justify unusually high stock market valuations. It remains to be seen whether investor enthusiasm for AI will eventually be supported by sustained improvements in fundamentals, or whether it instead turns out to be another episode of overly optimistic investor expectations.
The views expressed are those of the authors and do not necessarily reflect those of the Bank of Italy, the Federal Reserve Bank of San Francisco, or the Federal Reserve System.
References
Greenwald, Daniel. L., Martin Lettau, and Sidney C. Ludvigson. 2025. “How the Wealth Was Won: Factor Shares as Market Fundamentals.” Journal of Political Economy 133(4), pp. 1,083–1,132.
Hall, Robert E. 2017. “High Discounts and High Unemployment.” American Economic Review 107(2), pp. 305–330.
Jurado, Kyle, Sydney C. Ludvigson, and Serena Ng. 2015. “Measuring Uncertainty.” American Economic Review 105(3), pp. 1,177–1,216. Updated data available.
Lansing, Kevin J. 2008. “Speculative Bubbles and Overreaction to Technological Innovation.” FRBSF Economic Letter 2008-18 (June 20).
Lansing, Kevin J. 2020. “Assessing Stock Market Valuation with Macro Data.” FRBSF Economic Letter 2020-31 (October 13).
Laubach, Thomas, and John C. Williams. 2016. “Measuring the Natural Rate of Interest Redux.” Business Economics 51(2), pp. 57–67. Updated data available from New York Fed.
Data
Download figure data (Excel 438 mb)
Opinions expressed in FRBSF Economic Letter do not necessarily reflect the views of the management of the Federal Reserve Bank of San Francisco or of the Board of Governors of the Federal Reserve System. This publication is edited by Anita Todd and Karen Barnes. Permission to reprint portions of articles or whole articles must be obtained in writing. Please send editorial comments and requests for reprint permission to research.library@sf.frb.org