Download PDF (pdf, 401 kb)
Introduction
The average U.S. consumer still carries cash, despite reports that Americans don’t carry cash anymore. Last year, the Cash Product Office’s (CPO) paper, “Who Holds Cash?”, found the answer to its title to be: quite a lot of people. The paper used data from the 2012 Diary of Consumer Payment Choice to show that the majority of Americans (89 percent) carried cash to some extent over their three-day Diary period, and nearly two-thirds held cash every day of the Diary. The paper also looked at how often U.S. consumers held and spent cash, identifying four types of cash holders:
- “Cash Lovers” – consumers who held and spent cash every one of the three days of the Diary.
- “Just-in-Case Holders” – consumers who held cash every day of the Diary but didn’t use it during their three-day Diary. This group may view cash as a safety net or a contingency fund.
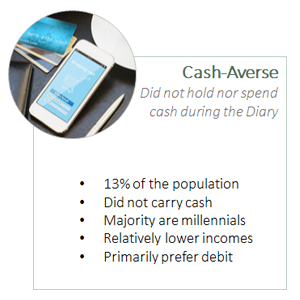
- “Cash-Averse” – consumers who neither held nor used cash as a payment instrument during their three-day Diary.
- “Limited Choice Spenders” – consumers who did not hold cash at the end of each Diary day but spent cash every Diary day.
Due to changes to the Diary instrument, data from the 2012 and 2015 Diary of Consumer Payment Choice are not directly comparable. However, the 2015 Diary should provide better data and insight, as it incorporated an improved questionnaire and a more representative sampling frame.1 This paper focuses on data from the 2015 Diary of Consumer Payment Choice and updates the CPO’s findings on consumer cash holding and spending behavior. It provides more detail into the different types of consumers carrying cash, and what these findings suggest for cash’s future.
General Cash Holding Update
In 2015, U.S. consumers tended to be in the extremes when it came to how often they held cash, with the majority (86 percent) either holding cash every Diary day or not at all. The average amount held each Diary day in 2015 was $59 and, excluding those who never held any cash, the average held was $71. The median amount held—in other words, the amount held by the middle consumer—was smaller at $21.
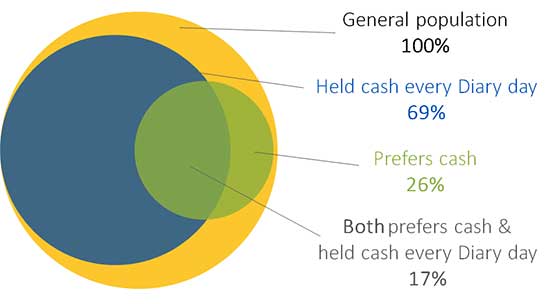
More than two-thirds (69 percent) of 2015 Diary participants carried cash every Diary day (Figure 1). Of these consumers, most preferred to use a payment instrument other than cash. Only a small share of the population—17 percent—both preferred to use cash and carried cash every Diary day. One reason for the large amount of consumers carrying cash despite preferring alternatives is that cash is most people’s backup payment of choice.2 Even consumers who prefer credit and debit turn to cash when their first payment choice is not available.
Figure 1
Population comparison
Cash Matrix: Four Holder Groups
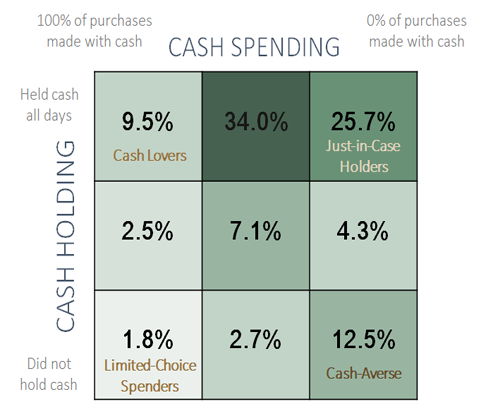
In “Who Holds Cash?”, the CPO differentiated between different types of cash holders using two factors: (1) how many of an individual’s three Diary days they ended holding cash (“cash holding”), and (2) how many days of their three Diary days they made at least one cash transaction (“cash spending”). Diary participants were given one of three labels for how frequently they held cash—either “all days” (3) of the Diary, “some days” (1-2), or “no days.” Similarly, participants were classified by how frequently they spent cash: they were labeled as spending cash “all days” (3) if they made at least one cash transaction each Diary day; “some days” if they made at least one cash transaction on either 1 or 2 days; and no cash transactions, or “no days,” if they did not make any cash transactions during their three-day Diary period.3
Combining the two factors, the matrix in Figure 2 depicts how frequently U.S. consumers held and spent cash in 2015, with darker squares indicating a larger portion of the population.
Figure 2
2015 cash holder matrix
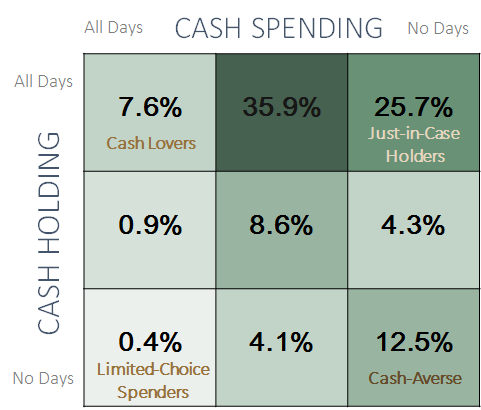
As in 2012, the largest portion of the population fell in the middle of the top row, holding cash all (3) days and spending cash some (1-2) days. Interestingly, when compared to 2012, in 2015 more consumers ended up in the top right and bottom right corners (either holding cash all days or not holding cash at all), though some of this difference may be attributed to the new sample of participants.
Focusing on the cash holder groups located at the outer corners, we observed changes in makeup of three of the four groups between the 2012 and 2015 Diaries. In 2015, the share of “cash lovers” was smaller, while the “cash-averse” (bottom right) and “just-in-case holders” groups were larger in size. Beyond changes in the total number of consumers in each group, there were demographic changes within each group as well. The next section explores each group in depth and examines the new findings.4 Further group statistics can be found in the appendix.
Cash Holder Group Case Analysis
Figure 3
Cash holder groups
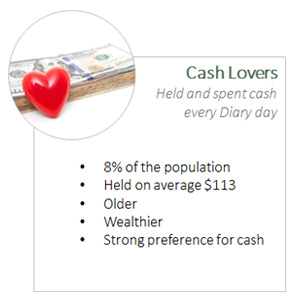
Cash Lovers
Cash lovers are the people you can trust to have cash on them at any time. They are devoted cash users, both holding and spending cash every day of the Diary. They made up 8 percent of the population in 2015 and tended to be older, wealthier, and have a strong preference for cash.
Cash lovers were the oldest group, with an average age of 54. Nearly one-third of the group was older than 65. Likely correlated to their ages, cash lovers were a relatively wealthy group compared to the general population. More than a quarter had household incomes greater than $100,000. The group’s higher incomes may contribute to its higher average daily cash holding of $113.
Rather unsurprisingly, cash lovers had a strong preference for cash. Nearly half (47 percent) stated cash as their preferred payment instrument; one third (30 percent) preferred debit, and 21 percent preferred credit. Consumers who chose cash and debit as their preferred ways to pay overwhelmingly cited convenience as their main motivation. For this group, cash and debit are favorable because they offer not only tighter spending controls but convenience and ease of use as well.
In general when compared to the general population, cash lovers are older and wealthier than the typical American consumer. However, the group looked different in 2015 than it did in 2012, comprised of a smaller share of the population and appearing more skewed in age. It could be that older consumers are remaining loyal cash users while younger consumers are dropping out of this category, either by spending or holding cash less frequently.
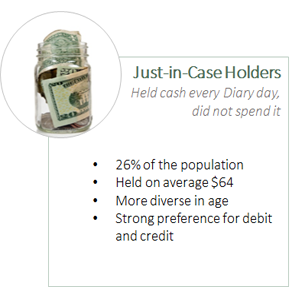
Just-in-Case Holders
Storing cash in your wallet as back-up or “just in case” appears to be on the rise among U.S. consumers. Just-in-case holders—people who held cash every Diary day but never spent it—made up 26 percent of the population in 2015. This group did not make any cash purchases during the Diary, though about a third of the group did not make any purchases in general during that time period. Just-in-case holders in 2015 exhibited diversity in terms of age, with a larger share of young consumers joining the ranks.
While just-in-case holders were the second oldest group, with an average age of 48, their ages were more evenly distributed than what was observed in 2012. There were more young consumers in this group in 2015, and nearly one third of just-in-case holders were between 18 and 34 years old. The group held on average $64 a day during the 2015 Diary.
Given that just-in-case holders never used cash during the Diary, their payment preferences mirrored their payment usage. Nearly half (45 percent) chose debit as their primary preferred payment instrument in 2015, and 38 percent chose credit. Only 13 percent of just-in-case holders chose cash as their preferred way to pay.
Just-in-case holders’ household incomes were more evenly distributed than cash lovers’. However, a large share of them fell in the higher income ranges, which is likely related to their credit preference and ability to have cash available for contingencies. More than a quarter (28 percent) had household incomes greater than $100,000 per year.
While just-in-case holders may view cash more as a contingency tool than their go-to payment instrument, it may be that more people are joining the bandwagon and adopting this view. Given the growth in the group’s size, it is possible that some young consumers are moving from cash lovers to just-in-case holders, especially if they hold cash but now choose another way to pay.
Cash-Averse
Cash-averse consumers neither held nor spent cash during the Diary. Similar to the CPO’s 2012 findings, these consumers were young and had lower incomes. In 2015, cash-averse consumers made up 13 percent of the population.
Cash-averse consumers were the youngest of the cash holder groups, with an average age of 38 and with more than half of its members (53 percent) falling into the millennial category. Given their relative youth compared to other groups, cash-averse consumers had relatively low incomes. One-third had household incomes less than $25,000 a year in 2015, and the majority (54 percent) had household incomes below $50,000.
As a whole, cash-averse consumers continued to favor debit (55 percent). A smaller share, 23 percent, preferred cash, followed by 17 percent preferring credit. Since nearly a quarter of cash-averse consumers prefer cash yet neither carry nor spend it, it’s possible that this segment of the group is liquidity-constrained rather than cash foes. Given their stage of life and current financial immaturity, cash-averse consumers who prefer cash may simply not have enough money to hold onto it.
Another explanation is that millennials are different and have an aversion to credit.5 This age cohort has lower adoption rates of credit cards than other cohorts.6 This distaste of debt may stem from the fact that millennials came of age during the recession and face saddling student loans.
Though the cash-averse made up only 13 percent of the population in 2015, they remain an important group to monitor in future research, especially in understanding whether their preferences are a permanent generational difference or simply a stage of life.
Conclusion
The 2015 Diary of Consumer Payment Choice saw significant movement in consumers’ cash holding behavior. Overall, consumers moved to the extremes in how often they held cash—either holding it every Diary day or not at all. Consumers were either finding little or high value in carrying cash.
Using the framework created to analyze the 2012 Diary, the CPO observed how the different types of cash holders looked in 2015. Cash lovers had fewer younger consumers and consisted largely of 65 and older consumers. On the opposite end of the spectrum, cash-averse consumers were made up primarily of millennials. The greatest movement took place with just-in-case cash holders. This group comprised one quarter of the nation’s population in 2015. Though just-in-case holders once had distinct traits, they were more diverse demographically in 2015. They are no longer a collection of older, wealthy consumers, and younger consumers seem to have joined in on the always holding, never spending action, as well.
The growth of people holding cash “just-in-case” comes at a time of seemingly conflicting reports about cash. The value of currency in circulation continues to grow on average 6 to 7 percent a year, outpacing nominal gross domestic product (GDP) growth.7 There is currently more than $1.5 trillion in circulation as of May 2017, up 35 percent from the $1.1 trillion in circulation at the end of 2012.8 Meanwhile, cash’s share of transactions is decreasing.9 The growth of just-in-case holders, with their unique view of cash, reflects larger cash trends of increasing currency in circulation and flattening or declining cash usage.
While it is too early to draw definitive conclusions from the first two Diaries of Consumer Payment Choice, it is possible that we are observing the development of a new use case of cash. Consumers may be demanding cash less as a means to pay, and more as a store of value. This theory falls in line with the general population’s movement towards always holding and never spending cash, and it is supported by the growth of just-in-case holders.
As new payments and technologies continue to emerge, cash retains a strong hold among consumers. Even if consumers choose not to use cash as their go-to payment instrument, they may take advantage of its near-universal acceptance and utility in contingency situations. The CPO will continue to monitor how consumers are holding and using cash to understand better cash’s changing role in the future.
Appendix
Table A-1
Cash holder groups
Download data (pdf, 111 kb)
Figure A-2
Cash holder matrix using share of cash purchases
Footnotes
1. More information about the Diary of Consumer Payment Choice, and the differences between the 2012 and 2015 Diaries, can be found in the appendix.
2. Federal Reserve Bank of San Francisco. (2016). The State of Cash: Preliminary Findings from the 2015 Diary of Consumer Payment Choice.
3. The Diary findings and matrix distribution shown in Figure 2 were similar when participants’ cash spending frequencies were calculated a second way: by the share of their total purchases for which they used cash. That new matrix (Figure A-2) can be found in the appendix.
4. Limited-choice spenders—those who did not hold cash at the end of the day yet consistently used it to make purchases (bottom left corner)—made up an insignificant share of the population in both 2012 and 2015. Though it might seem impossible for a group to never hold yet always spend cash, the CPO believes that individuals in this category may be less affluent and forced to use any cash on-hand for immediate expenses. They are most likely unable to afford holding onto cash. Examples of consumers who may fall into this group include people who are paid daily in cash and low-income, unbanked individuals with little access to debit or credit cards. Due to the small number of observations in this category, any conclusions drawn about limited-choice spenders would be neither statistically significant nor nationally representative.
5. The Washington Post. (2014, September 8). More than 6 in 10 Millennials Say They Don’t Have a Credit Card.
6. Federal Reserve Bank of Boston. (2015). Payment Instrument Adoption and Use in the United States, 2009-2013, by Consumers’ Demographic Characteristics.
7. Federal Reserve Bank of San Francisco. (2012). Annual Report: Cash is Dead! Long Live Cash!
8. Federal Reserve Board of Governors. (2015, March 2). FAQs: Currency and Coin.
9. Federal Reserve Bank of San Francisco. (2016). The State of Cash: Preliminary Findings from the 2015 Diary of Consumer Payment Choice.
About the Cash Product Office
As the nation’s central bank, the Federal Reserve ensures that cash is available when and where it is needed, including in times of crisis and business disruption, by providing FedCash® Services to depository institutions and, through them, to the general public. In fulfilling this role, the Fed’s primary responsibility is to maintain public confidence in the integrity and availability of U.S. currency.
The Federal Reserve System’s Cash Product Office (CPO) provides strategic leadership for this key function by formulating and implementing service level policies, operational guidance, and technology strategies for U.S. currency and coin services provided by Federal Reserve Banks nationally and internationally. In addition to guiding policies and procedures, the CPO establishes budget guidance for FedCash® Services, provides support for Federal Reserve currency and coin inventory management, and supports business continuity planning at the supply chain level. It also conducts market research and works directly with financial institutions and retailers to analyze trends in cash usage.
About the Diary of Consumer Payment Choice
This paper uses a dataset from the Diary of Consumer Payment Choice (Diary) conducted by the Federal Reserve Banks of Boston, Richmond, and San Francisco. The Diary is a survey designed to study the purchase and payment behavior of U.S. consumers. The study is conducted using a nationally representative sample of U.S. consumers. The second fielding of the Diary of Consumer Payment Choice took place from October 16 to December 15, 2015. Participants were asked to record information on all transactions—purchases, bill payments, deposits, withdrawals, etc.—conducted during an assigned consecutive three-day period.
The 2015 Diary is the second iteration of this research initiative by the Federal Reserve Banks of Boston, Richmond, and San Francisco. Both the 2012 and 2015 Diaries surveyed a random sample of respondents across the United States, and responses were weighted to match the Census Bureau’s Current Population Survey population estimates. In 2012, participants were asked to record their transactions in the month of October to minimize seasonality effects in consumer spending patterns. Their responses were also staggered over the month of October to ensure almost equal numbers of participants each day. In 2015, participants were asked to record their transactions in the months of October, November, and December, and responses were staggered to ensure almost equal numbers of participants per Diary day.
Changes to the 2015 Diary of Consumer Payment Choice Structure
For both the 2012 and 2015 Diaries, participants tracked all transactions (deposits, withdrawals, purchases, bills, etc.) for an assigned, consecutive three-day period within the observation window. In 2012, the observation window was the month of October. The 2015 Diary expanded the observation window from October 16 to December 15. This extended timeframe allowed researchers to observe payment choice and purchase behavior through part of the 2015 holiday season.
Other additions to the 2015 Diary included:
- A separate bill payment module at the end of a diarist’s third day to improve bill payment records during the observed Diary period
- Follow-up questions regarding card acceptance to determine whether individuals were using cash for convenience or out of necessity
- Additional preference questions to allow participants to specify different payment preferences based on transaction value and on whether the purchase took place in-person or not
The 2015 Diary also revealed a marked change in the total number of transactions and small-value transactions when compared to the inaugural 2012 study. This reduction likely impacts small-value transactions that took place in-person and had a high probability of cash use. More information about this reduction can be found in the paper “U.S. Consumer Cash Use, 2012–2015: An Introduction to the Diary of Consumer Payment Choice” (2017) by Claire Greene, Shaun O’Brien, and Scott Schuh.
The differences between the 2012 and 2015 Diary data are not solely attributed to either economic conditions or consumer behavior changes. Many changes were implemented in the 2015 Diary to better understand payment preferences, increase accuracy with the number of bill and non-bill payments, and determine whether cash use was high due to a lack of card readers. In addition to the questionnaire changes, the panelists for the Diary changed between 2012 and 2015. The RAND American Life Panel was used for the 2012 Diary, while the Understanding America Study was used for 2015. Both panels were designed to be nationally representative, but the samples themselves are not the same. The measurement differences between these two years captures all of the questionnaire, panel, and economic changes; consequently, it is important to keep in mind that the 2012 and 2015 findings represent two distinct points in time and not a marked trend. The CPO is monitoring insights revealed in the 2015 data, but only with additional data will we be able to learn more and draw more definitive conclusions about payment trends.