Download PDF (pdf, 302 kb)
Summary
The 2018 report on the Diary of Consumer Payment Choice (DCPC) was the fourth Diary study conducted by the Federal Reserve. A demographically-representative sample of approximately 2,800 individuals participated in the Diary in October 2017. Findings from the 2017 DCPC show:
- Cash continues to be the most frequently used payment instrument, representing 30 percent of all transactions and 55 percent of transactions under $10.
- While online shopping continues to grow, 77 percent of payments were made in-person.1 For these in-person payments, cash accounted for 39 percent of the volume.
- Survey respondents between 18 to 25 years of age and those 45 years and older use cash approximately 34 percent of the time to pay for transactions.
- In 2017, consumers held more cash on average than their 2015 and 2016 counterparts, though the difference was not statistically significant.
Consumers continue to use cash predominantly for smaller value transactions, with cash being used for 55 percent of payments under $10 and for 32 percent of payments between $10 and $24.99. Because the majority of reported transactions were below $25 in value, cash was the most used instrument overall. Debit and credit cards were generally used for larger transactions, with the average debit and credit transaction being $46 and $67, respectively. For purchases between $10 and $24.99, debit cards were used 34 percent of the time. Interestingly, 2017 represents the first year debit was used at a higher rate than cash within this price range.
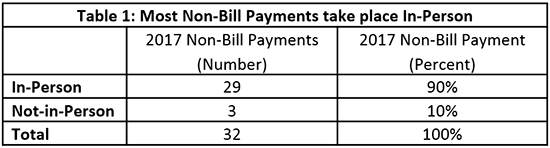
Participants reported making approximately three quarters of all payments in-person and, for those payments, cash was used approximately 39 percent of the time. For the one quarter of payments that took place not-in-person — payments for which the use of cash is not an option — 75 percent were bill payments. The data shows that, on average, 90 percent of non-bill payments continue to be made in-person.
Individuals between 18 and 25 made approximately 24 payments per month, with debit cards comprising 12 of those payments and cash making up 8 of the 24 total payments. While debit was the most used instrument for the younger cohort, the share of cash use was the same for individuals 18 to 24 and 45 and older at 34 percent. Individuals aged 25 to 44 used cash for approximately 10 transactions per month, which equated to about 25 percent of payments for this age group.
Finally, the average daily value of cash held by consumers continued to increase in 2017 at $59 per person compared to $57 in 2016 and $51 in 2015, although these findings were not statistically significant.
The body of this paper is structured into four sections, with each section exploring various aspects of cash usage. Section 1 details trends in cash usage; Section 2 discusses how payment preferences influence the use of cash; Section 3 explores cash holdings by demographic cohort; and Section 4 outlines payment use by transaction characteristic and merchant type. Appendix A provides an overview of methodology. Additional information about the 2017 DCPC is available through the Federal Reserve Bank of Atlanta.2
Acknowledgements
This paper would not have been possible without the support and contributions of the following individuals. From the Atlanta Fed: Kevin Foster, Claire Greene, and Marcin Hitczenko. From the Boston Fed: Jason Premo, Joanna Stavins, and Liang Zhang. From the San Francisco Fed: Anna Baram, Fernanda Nechio, and Louise Willard. From the Cash Product Office: Alexander Bau, Amy Burr, Barbara Bennett, Ben Gold, Raynil Kumar, Tayeba Maktabi, Wendy Matheny, Kelly McGuire, Shaun O’Brien, Steve Son, Claire Wang, and Kathleen Young. Finally, the Richmond Fed for their continued support of this research.
Section 1. Trends in Cash Usage
Cash remains the most used payment instrument
For the 2017 diary period, participants made approximately 1.3 payments per day, down from 1.5 and 1.6 payments per day in 2016 and 2015, respectively.3 The 2017 average daily payments equate to about 41 payments per month, including both bill and non-bill payments. As Figure 1 shows, cash was the most frequently-used payment instrument in 2017 for these 41 payments, accounting for 30 percent (12.4 payments) of all payments, followed by debit at 27 percent (10.8 payments), and credit at 21 percent (8.6 payments).4
Figure 1
Share of Instrument Payment Usage by Year
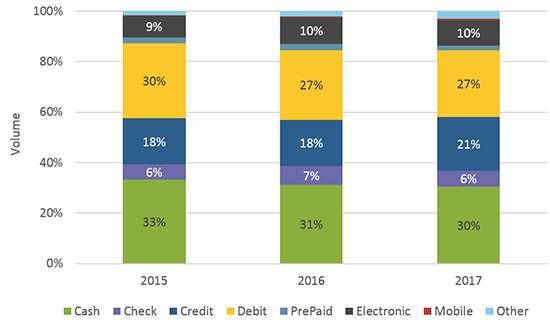
Despite being the most common form of payment, cash’s share declined one percentage point from 2016 to 2017 and three percentage points since 2015. Exactly which payment instrument is being used as a substitute for cash is not clear, as the three percentage point increase in credit from 2016 to 2017 does not correspond with a three percentage point decline in cash or debit.
Additionally, the 2017 DCPC participants reported fewer payments than the 2016 participants (41 in 2017 compared from 46 in 2016). This suggests the movement in shares is partially driven by a reduction in the number payments and not necessarily a substitution from one instrument to another. For example, 2017 DCPC participants made fewer cash payments than their 2016 DCPC counterparts (12 in 2017 compared to 14 in 2016) as well as fewer debit payments (12 vs 11), while credit increased by one to nine payments.5
Cash is used predominantly for small-value purchases
Consumers tend to have many more small-value payments than high-value payments with an average of about 22 payments valued at or below $24.99, compared to 12 payments valued at $50 or more.
As noted previously, cash is used most often for low-value payments. As a result, it has a high share of the total volume but a low share of the total value of payments (Figure 2). In contrast, electronic payments, such as recurring auto-drafts for mortgage and car payments and one-time bank account drafts initiated on a merchant’s or biller’s website, represent fewer total payments but make up a significantly larger proportion of total payment value.
Figure 2
Share of Value by Instrument and Year
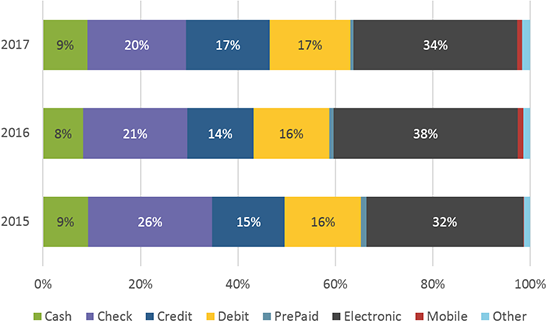
Figure 3 shows the breakdown by payment instrument for various price ranges, with cash accounting for 55 percent of all payments under $10 and 32 percent of payments between $10 and $24.99. As transaction values increase, there is increased use of debit and credit cards, which account for a majority of transactions between $10 and $99.99. For purchases of $100 or more, consumers greatly increase their use of checks and electronic payments, which account for half of their payments at this price point.
Figure 3
Payment Instrument Usage by Purchase Amount – 2017
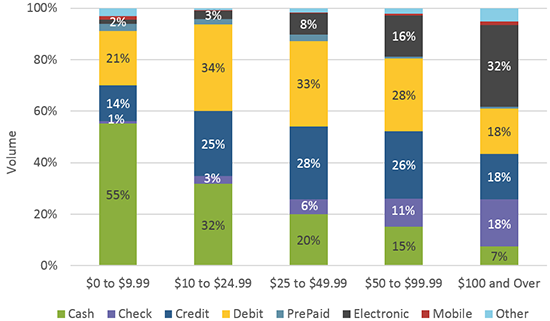
Figure 3 shows that for payments between $10 and $24.99 debit cards were used slightly more frequently than cash. In all previous years, participants have reported more cash payments than debit card payments within this price range. However, between 2016 and 2017, cash’s share declined five percentage points while debit increased one percentage point (figure not shown).
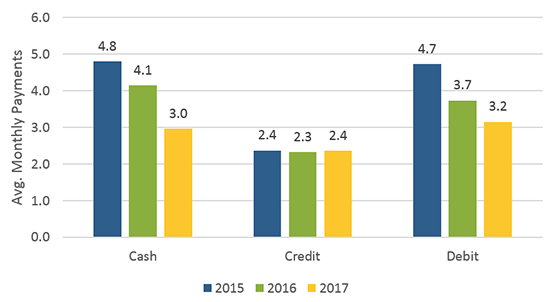
The shift in payment shares does not appear to be the result of substitution away from cash towards debit and credit. If individuals were using debit and credit in place of cash, then decreasing cash usage should be accompanied by an increase in either debit or credit (Figure 4). Instead, the reason for the change in shares is cash usage dropped more sharply in the $10 – $25 bucket than debit, while credit was unchanged, resulting in a loss of market share for cash.
Figure 4
Number of Payments between $10 and $25
Section 2. Who is using cash?
Cash use spans payment preferences
As with previous years, the 2017 DCPC asked participants about their preferred payment methods for bill payments and non-bill payments, as well as their secondary preferences assuming their primary method was not available. Since 2015, cash, credit, and debit have consistently made up approximately 95 percent of the overall preferences. However, shares among those three have shifted.
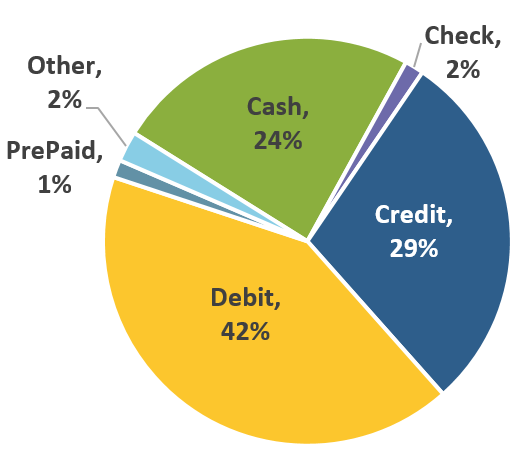
Most notably, in 2017, 29 percent indicated a preference for paying with credit (Figure 5), a five percentage point increase from 2016. This increase resulted in credit card preference surpassing the preference for cash.
Figure 5
2017 Payment Preference
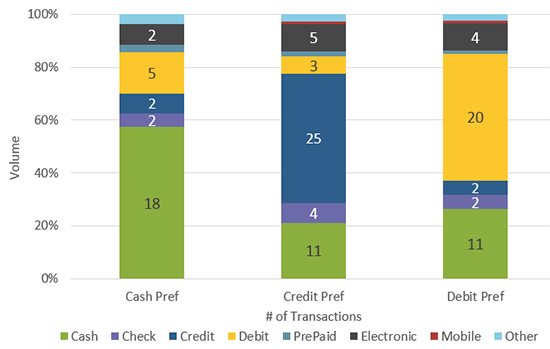
While payment preference may signal the payment instrument a consumer uses most often, data from the DCPC indicate that, regardless of preference, a wide range of payment instruments are used. Figure 6 shows the number and share of payment instruments used when individuals are sorted by their stated preference. In general, each individual’s most frequently-used payment instrument aligns with his/her preference. Consumers who prefer using cash as their primary payment instrument make 18 cash payments out of 31 total monthly transactions. Individuals preferring credit cards make approximately 25 credit transactions out of 50 monthly transactions, and those preferring debit cards make 20 debit payments per month out of a total of 41 transactions. At the same time, those preferring debit or credit cards also had approximately 11 cash payments per month, representing 21 and 26 percent of their transactions, respectively. This indicates that, regardless of payment instrument preference, cash was a popular secondary payment instrument used to pay for transactions – particularly for low-value transactions, as noted earlier.
Figure 6
Payment Instrument Usage by Preference – 2017
Cash is used across all age groups
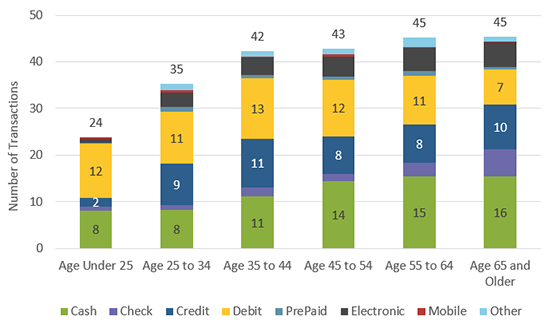
Most age groups use cash relatively often (Figure 7). By share of total payments, cash use is lowest among 25 to 44 year olds, while those under 25 and those aged 45 and over use cash for about 34 percent of transactions. Even though individuals younger than 25 years have the same share of cash transactions as older individuals, they make fewer cash purchases in absolute terms (Figure 8). Individuals who were 25 years or younger had about 8 cash transactions (out of 24 total) compared to 16 cash transactions (out of 45 total) for individuals 65 years or older.
Figure 7
Percent Payment Instrument Usage by Age – 2017
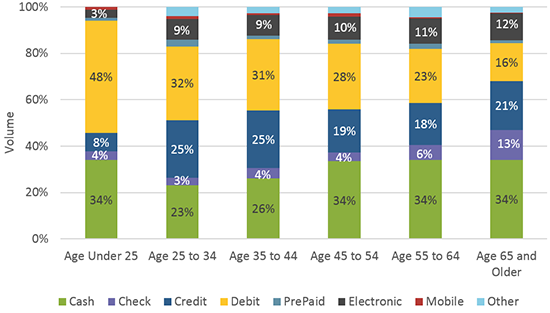
Figure 8
Payment Instrument Usage by Age – 2017
Cash use is consistent as incomes rise, but its share of total transactions falls
For individuals in households that earn $50,000 or less, cash is the most common form of payment, followed by debit. As income rises, credit and debit replace cash as the most commonly used payment instrument (Figure 9).
Figure 9
Payment Instrument Usage Shares by Household Income
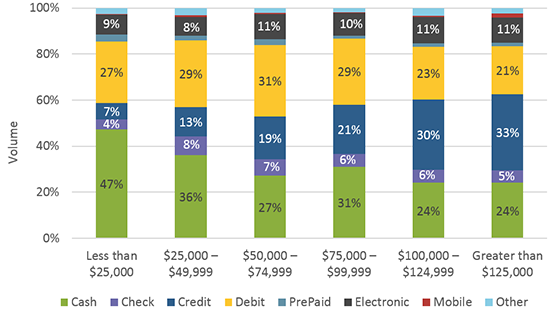
At incomes above $100,000, households use credit cards to pay for the largest number of transactions (33 percent), followed by cash as the secondary payment instrument (24 percent).
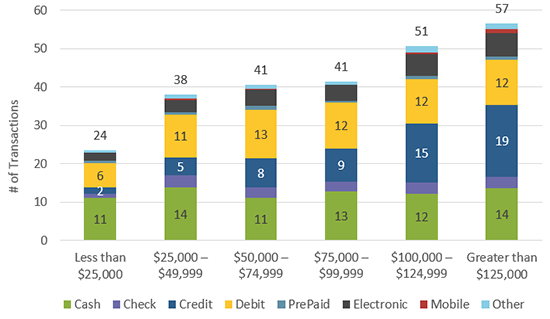
It is important to note that households earning less than $25,000 consume less and have fewer monthly transactions (24) than higher income households ($125,000 and above) that have, on average, 57 total monthly transactions (Figure 10). However, in absolute terms, the number of cash transactions is almost equal across all income earners, ranging from 11 to 14 transactions per month.
Figure 10
Payment Instrument Usage by Household Income
Section 3. Who is holding cash?
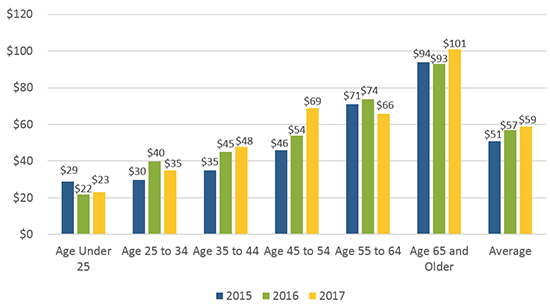
The amount of cash people hold varies by their age and income
Average cash holdings have increased in the aggregate from 2015 to 2017, though the increase from year to year is not statistically significant. However, average cash holdings by specific age groups and household incomes have fluctuated from 2015 to 2017. Of the six age cohorts, four saw holdings fluctuate across the years, while two groups, ages 35 to 44 and 45 to 54, saw an uptick in holdings during each year, though not statistically significant (Figure 11).
Figure 11
Average Daily Holdings by Age & Year
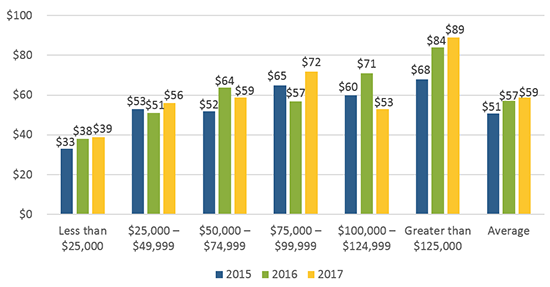
Similarly, cash holdings by household income fluctuated over the same three-year period (Figure 12). However, households with incomes below $25,000 and with incomes above $125,000 show a steady increase in cash holdings.
Figure 12
Average Daily Holdings by Household Income & Year
Section 4. Where is cash being used?
More transactions are made in-person with cash than debit or credit
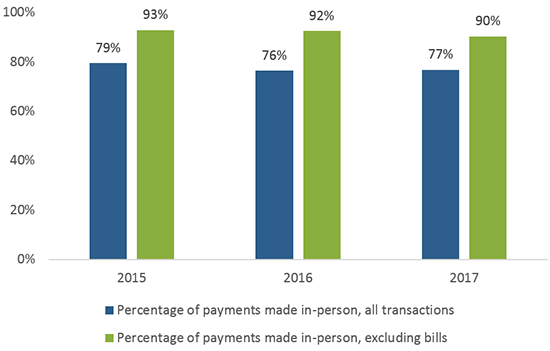
A major determinant of a consumer’s payment choice, beyond preference, is whether the transaction takes place in-person. Despite the well-publicized growth in online shopping, consumers continue to make more than three-quarters of payments in person. When bill payments are excluded from total transactions, the 2017 share of in-person transactions stands at 90 percent, despite a slight year-over-year decline (Figure 13).
Figure 13
Percent of Payments Made In-Person, by Year
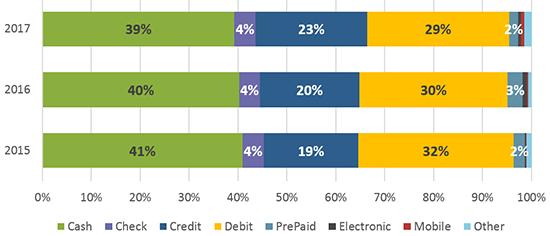
As one would expect, cash represents a larger share of payments when looking only at in-person transactions, effectively excluding those online transactions for which cash use is not an option (Figure 14). In-person cash transactions dipped below 40 percent for the first time in 2017, with credit cards seeming to take market share from both cash and debit.
Figure 14
Percent In-person Transaction Payment Use by Year
Cash use remains high in P2P, Auto and Vehicle, and Food and Personal Care Expenditures
Consumers’ payment choices vary widely by expenditure type but, within each expenditure category (Figure 15), cash makes up a significant share of payments and accounts for the largest share within six of these categories.6 With the exception of payments for financial and professional services, cash accounts for at least 18 percent of payments to merchants and other payees. In addition, for two categories (government / nonprofit payments and gifts / transfers to people) not only is cash usage high, but debit and credit card use is quite low.
Figure 15
2017 Payment Instrument Use by Merchant
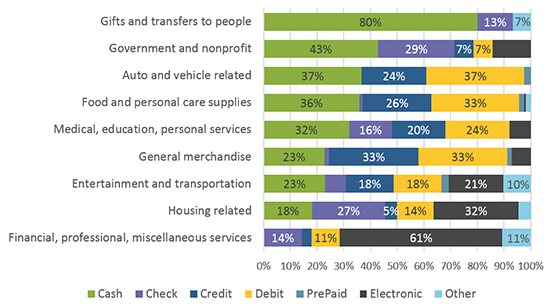
While there are many options for making person-to-person payments (P2P), cash continues to account for 80 percent of the volume for this payment type, the same percentage in the 2015 DCPC. However, 2017 is first year where participants reported making P2P payments with instruments like Zelle, Venmo, Apple Pay, and Google Pay (Other, 7 percent). In both the 2015 and 2016 DPCP, no transactions using these apps were reported.
Conclusion
As retailers and payment providers compete to deliver new ways to shop and pay, data from the 2017 DCPC shows that consumers continue to demand and pay with cash about as frequently as in previous years and that their usage is relatively similar across age groups. In particular, cash remains a popular payment method for small value transactions. Furthermore, when considering preferences, cash remains a preferred secondary payment choice regardless of what payment instrument consumers prefer to use primarily.
In addition, the 2017 DCPC also indicates that individuals are holding more cash than previous years, particularly at the lower and upper bounds of the income distribution. While cash continues to be the most frequently-used payment instrument, its share of payments declined modestly in 2017 from 31 to 30 percent.
The 2017 DCPC data also show that in-person transactions make up more than 75 percent of all transactions indicating that, despite the growth in opportunities to shop and pay online, most transactions still take place in-person. For these in-person payments, cash represents a large share (39 percent) of transactions. Even when looking at cash use by merchant type, cash continues to be a popular payment instrument for a variety of retailers.
The 2017 DCPC illustrates the prominence of cash use across age groups, households, and merchants. These findings demonstrate the important role cash continues to play in commerce.
APPENDIX
Diary of Consumer Payment Choice
The Federal Reserve’s national Cash Product Office (CPO) uses data from the Diary of Consumer Payment Choice (DCPC) to understand consumer cash use and anticipate its ongoing role in the payments landscape. Developed by the Federal Reserve Bank of Boston’s Consumer Payment Research Center (CPRC), the DCPC includes a unique, nationally representative survey of consumer shopping and payment decisions administered by the University of Southern California (USC) Dornsife Center for Economic and Social Research. USC’s Understanding America Study panel comprises approximately 6,000 individuals from across the United States, of which 2,848 panelists completed the 2017 Diary.
By tracking consumer payment transactions and preferences during the month of October every year, the CPO compares cash with other payment instruments, such as debit and credit cards, checks, and electronic options. DCPC participants also report the amount of cash on-hand after each survey day, as well as whether they deposited or withdrew cash throughout the day. The CPO analyzes the DCPC data, including the impact of age and income on an individual’s payment behavior and preferences. This detail of the stock and flow of cash at an individual level provides insight into how consumers use cash.
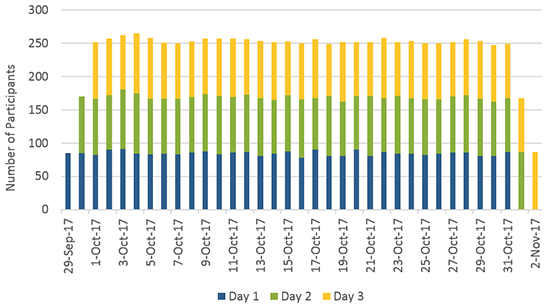
To ensure a nationally representative sample, responses are weighted to match national population estimates based on the Census Bureau’s Current Population Survey. The DCPC is administered throughout the month of October, which was selected as a “typical month” to minimize seasonality effects in consumer spending patterns. Participants were each assigned a three day period within the month, with some individuals assigned a starting date in late September and others assigned to finish in early November. As Figure A1 shows, this ensures a near uniform distribution of participants for each October day. For a more detailed description of the Diary of Consumer Payment Choice, see Angrisani, Foster, and Hitczenko (2017b); Angrisani, Foster, and Hitczenko (2018); Greene, Schuh, and Stavins (2018); Greene and Schuh (2017); Greene, O’Brien, and Schuh (2017); and Schuh (2017).
Figure A1
2017 Diary Participation by Diary Day and Date
About the Cash Product Office
As the nation’s central bank, the Federal Reserve ensures that cash is available when and where it is needed, including in times of crisis and business disruption, by providing FedCash® Services to depository institutions and, through them, to the general public. In fulfilling this role, the Fed’s primary responsibility is to maintain public confidence in the integrity and availability of U.S. currency.
The Federal Reserve System’s Cash Product Office (CPO) provides strategic leadership for this key function by formulating and implementing service level policies, operational guidance, and technology strategies for U.S. currency and coin services provided by Federal Reserve Banks nationally and internationally. In addition to guiding policies and procedures, the CPO establishes budget guidance for FedCash® Services, provides support for Federal Reserve currency and coin inventory management, and supports business continuity planning at the supply chain level. It also conducts market research and works directly with financial institutions and retailers to analyze trends in cash usage.
Footnotes
1. As the term implies, in-person payments occur when the payer makes a payment at the payee’s physical location; for example, purchases of items at grocery stores, gas stations, vending machines, and toll booths. Payments defined as not-in-person are those where the consumer and merchant are not in the same location when the payment is made. Examples of not-in-person payments include shopping online, sending a check in the mail, and subscribing to a digital music service. The use of a specific device does not necessarily indicate whether the transaction took place in-person or not. Using a credit card with Apple Pay at the grocery store or a transponder at a toll booth are defined as in-person credit payments utilizing a mobile device, while mailing a birthday check would be considered a not-in-person transaction.
2. https://www.frbatlanta.org/banking-and-payments/consumer-payments/research-data-reports/2018/the-2017-diary-of-consumer-payment-choice.aspx?panel=1
3. For additional information regarding the DCPC, see Angrisani, Foster, and Hitczenko (2017b); Angrisani, Foster, and Hitczenko (2018); Greene, Schuh, and Stavins (2018); Greene and Schuh (2017); Greene, O’Brien, and Schuh (2017); Sampranathak, Schuh, and Townsend (2017); and Schuh (2017).
4. “Electronic” payments include bank account number payments, online banking bill pay, and payment services like PayPal. “Other” payments include money orders, traveler’s checks, transfers, and direct deposit.
5. Participants have reported fewer payments for the past three years, with the average number of monthly payments declining from 50 payments in 2015 to 41 in 2017. Preliminary analysis does not indicate that the makeup of the participants for each year has changed, nor has there been an increase in the number of people whose participation seems to taper off over the course of the three days they are assigned to record payments. Instead, this decline in the number of monthly payments may be the result of a change in consumers’ seasonal (or other) purchasing behavior, or potentially a reflection of year-to-year random variation within the DCPC. The Federal Reserve continues to analyze this phenomenon and will make appropriate adjustments to these estimates if the analysis suggests they are necessary.
6. It is noteworthy that no cash use was reported for purchases of financial, professional, and miscellaneous services during the 2017 survey. Additionally, the total number of these types of transactions decreased by more than 50 percent over the same time period. These changes may be explained by how participants recorded bill payments and how the payments were categorized, which changed over the same three year period (though other merchant categories traditionally associated with bill payments did not see such drastic changes). The CPO and its survey partners are conducting further analysis on the year-to-year changes and will provide updates as needed.
References
Angrisani, Marco, Kevin Foster, and Marcin Hitczenko. 2017b. “The 2012 Diary of Consumer Payment Choice: Technical Appendix.” Federal Reserve Bank of Boston Research Data Reports No. 17-5.
Angrisani, Marco, Kevin Foster, and Marcin Hitczenko. 2018. “The 2015 and 2016 Diaries of Consumer Payment Choice: Technical Appendix” Federal Reserve Bank of Boston Research Data Reports No. 18-2.
Greene, Claire, and Scott D. Schuh. 2017. “The 2016 Diary of Consumer Payment Choice.” Federal Reserve Bank of Boston Research Data Reports No. 17-7.
Greene, Claire, Shaun O’Brien, and Scott Schuh. 2017. “U.S. Consumer Cash Use, 2012–2015: An Introduction to the Diary of Consumer Payment Choice.” Federal Reserve Bank of Boston Research Data Reports No. 17-6.
Greene, Claire, Scott D. Schuh, and Joanna Stavins. 2018. “The 2012 Diary of Consumer Payment Choice: Summary Results.” Federal Reserve Bank of Boston Research Data Reports No. 18-1.
Schuh, Scott. 2017. “Measuring Consumer Expenditures with Payment Diaries.” Federal Reserve Bank of Boston Research Department Working Papers No. 17-2.