Download PDF (pdf, 271 kb)
Download Chart Data (Excel document, 63 kb)
Introduction
The Federal Reserve’s national Cash Product Office (CPO) partners with the Federal Reserve Bank of Atlanta and Federal Reserve Bank of Boston to conduct the annual Diary of Consumer Payment Choice survey each October. Since 2016, this survey has provided useful insights into how consumer payment practices and preferences have shifted over time. Recognizing the extraordinary disruption to payments practices that the COVID-19 pandemic presented, the CPO and the Federal Reserve Bank of Atlanta conducted a supplemental survey in April 2020 as part of the University of Southern California’s COVID-19 longitudinal survey.1 The April survey revealed that U.S. consumers’ average store of value cash holdings had increased by more than $200 from October 2019 levels to nearly $485 per consumer in April 2020. At the same time, only one-third of consumers reported making any in-person payments, compared to 96 percent in October 2019.
After completion of the first supplemental survey in April, several economic factors changed which could have affected cash usage. For example, demand for currency increased with the aggregate value of currency in circulation (CIC) nearing $2 trillion at the end of July, unemployment declined from 14.7 percent in April to 8.4 percent in August, U.S. cities and states began lifting stay-at-home orders, and businesses began reopening.
In addition, the pandemic significantly disrupted the supply chain and circulation of coin, resulting in the Federal Reserve temporarily implementing a coin allocation policy that established upper-bound limits on the amount of coin that financial institutions (FIs) were able to order. Coin-intensive businesses and financial institutions experienced significant challenges accessing coin, prompting many businesses to nudge consumers to change their payment behaviors.
To assess the continued and evolving impact of the pandemic, a second supplemental survey was fielded in August. In this August survey, respondents answered questions regarding in-person shopping behavior, their experience using coins, and their cash holdings. Combined with the October 2019 Survey and Diary of Consumer Payment Choice, the April and August supplemental surveys allow us to examine consumers’ behavior over time: before, at the beginning of, and during the COVID-19 pandemic.2 Overall, the survey finds that:
- Cash holdings have increased throughout the pandemic, with an average household store of value held in cash at about $530 in August. Respondents stated that cash held in their pocket, purse, or wallet has remained stable at around $70.
- The share of respondents who made an in-person payment in the 30 days prior to completing this survey increased to 60 percent, up from 34 percent in April.
- More than 40 percent of respondents reported switching to making payments online or over the phone for payments previously made in-person.
- While most consumers using cash received change despite the coin circulation issue, only four percent of respondents reported either depositing coin at a financial institution or a kiosk.
Section 1. Individual cash holdings remain elevated
Store of Value Cash Increases as Pandemic Continues
On March 13, 2020, the President declared a national emergency as a result of the COVID-19 global pandemic. Two weeks later, on March 27, 2020, the CARES Act was signed into law, which provided more than 160 million Economic Impact Payments (EIPs)—worth nearly $275 billion—to many Americans and supplemented weekly state unemployment benefits by $600.3 Between March 13 and the start of the first supplemental Diary survey on April 15, the value of CIC increased by $70 billion. Below we examine the relationship between cash holdings and the increase of CIC as a result of the pandemic and the CARES act.
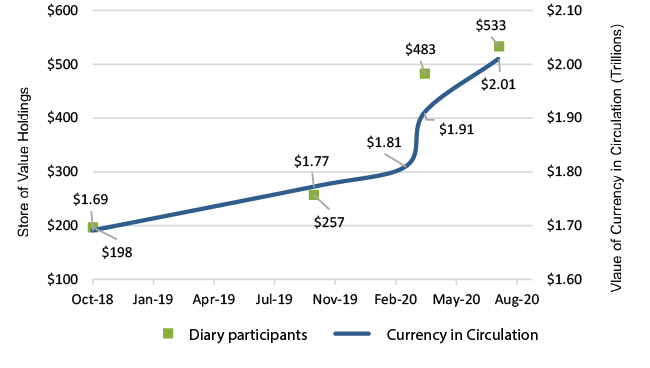
In all the consumer surveys discussed here, respondents reported cash held in pocket, purse or wallet, as well as cash stored elsewhere. This paper assumes that individuals storing cash elsewhere intend to use this cash as a store of value rather than for near-term transactional purposes. In October 2019, the average store of value cash holdings for these respondents was approximately $250. In April, however, the same respondents reported that their store of value cash holdings had increased to an average of $483. Cash holdings increased even further in August with reported cash holdings averaging $533.4 Figure 1 shows consumer cash holdings and CIC from October 2018 to August 2020. The increase in consumer cash holdings is correlated with CIC, which increased by $200 billion between March 2020 ($1.81 trillion) and August 2020 ($2.01 trillion).
Figure 1
Increased CIC is Correlated with Increased Consumer Holdings
Increases in cash holdings likely driven by uncertainty, rather than distribution of EIPs
To determine whether EIPs affected store of value cash holdings, we utilized all of the USC COVID-19 surveys fielded since April 1st to determine which individuals received either EIPs or unemployment benefits and when those benefits were received since the passage of the CARES Act.5,6 Since EIPs were not distributed all at once, we utilized the timing difference of EIPs to estimate how this benefit affected store of value cash holdings against how the uncertainty of the pandemic affected these same holdings.
To limit any confounding effects the supplemental unemployment benefit may have on store of value cash holdings, respondents who received unemployment benefits at any point since the passage of the CARES Act were not included in the analysis shown in Table 1. Since those making more than $200,000 in October 2019 were not eligible for EIPs, those individuals were also not included in the analysis.7 The remaining 2,178 respondents were then divided into three groups.8,9 Approximately 60 percent of respondents received EIPs within two weeks prior to answering the April survey and are labeled as Group 1 in the table below. Group 2 comprises nearly 28 percent of respondents who received EIPs, but after answering the April survey. The remaining 12 percent are respondents in Group 3 who reported never receiving an EIP and are used as a comparison group against Group 2 and 3.
If EIPs were the key reason respondents increased their store of value cash holdings, then in the April data, one would expect to see an increase in cash holdings in Group 1, who received their EIPs shortly before the April survey, that is greater than any increase in store of value cash holdings for Groups 2 and 3 who had not received their EIPs. While Group 1 increased their holdings by $269, it was found that Group 3 increased their store of value cash holdings by about $182, unrelated to any EIP. Additionally, the August 2020 store of value cash holdings for Group 2 should show an increase in holdings greater than any increase reported by Group 3, as Group 3 had not received an EIP by the August survey. While this is the case, Group 2 only increased their holdings by $11 when compared to their April holdings, indicating that EIP was not the main driving force behind their change in store of value cash holdings. Finally, Group 3 still increased their store of value cash holdings after the start of the pandemic, despite not receiving an EIP or unemployment benefits. This increase in store of value cash holdings could be attributed to uncertainty as a result of the pandemic.
The changes across these three groups suggest that changes in store of value cash holdings are not highly correlated to EIPs and are likely due to other factors. Both Group 1 and Group 3 have lower median household income and lower store of value cash holdings compared to Group 2 in October 2019. This suggests that store of value cash holdings in April 2020 and August 2020 may be related to household income and store of value holdings prior to the pandemic, rather than EIPs alone. While the data cannot specifically determine how strongly the changes in cash holdings were driven by EIPs or uncertainty around the pandemic, no group has reduced their store of value holdings to pre-pandemic levels. If EIPs were a key driver in respondents increasing cash holdings, the continued uncertainty regarding the pandemic may explain why respondents continue to hold an increased amount of store of value cash.
Table 1: Changes in Mean Store of Value Cash Holdings for Recipients of Economic Impact Payments10
| Store of Value Holdings in… | Group 1 Received EIP within two weeks of April Survey | Group 2 Received EIPs after April Survey | Group 3 Reported No EIPs as of August |
|---|---|---|---|
| October 2019 | $152 | $662 | $72 |
| April 2020 | $421 | $670 | $254 |
| August 2020 | $510 | $681 | $214 |
| Average Household Size | 1.8 | 1.7 | 1.6 |
| Median October 2019 Household Income | $58,000 | $70,000 | $55,000 |
| Number of Respondents | 1,291 | 609 | 278 |
Cash on Person Returns to Pre-Pandemic Levels
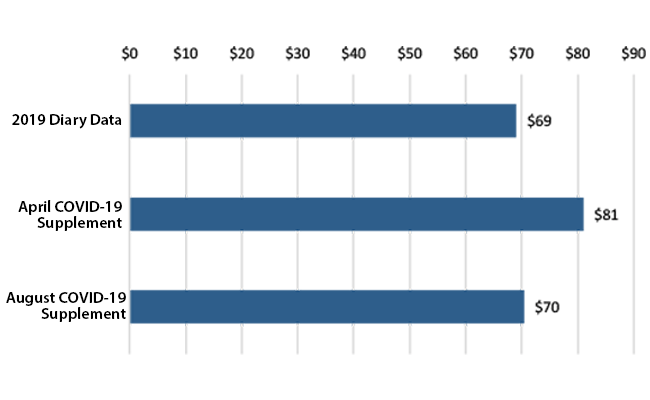
In addition to store of value cash holdings, survey respondents also reported the value of cash held in their pocket, purse, or wallet. Compared to October 2019, the average value of cash held increased by 16 percent to $81 in April 2020. However, the average value reported in August decreased back to 2019 levels of $70 (Figure 2). The simultaneous increase in the value of cash stored elsewhere and decrease in value held on one’s person suggests that consumers had less incentive to carry and use their extra cash during the pandemic and have therefore shifted towards a store of value use rather than as a payment use.
Figure 2
Mean Cash in Pocket, Purse, or Wallet
Section 2. Shopping patterns continue to change in response to the pandemic
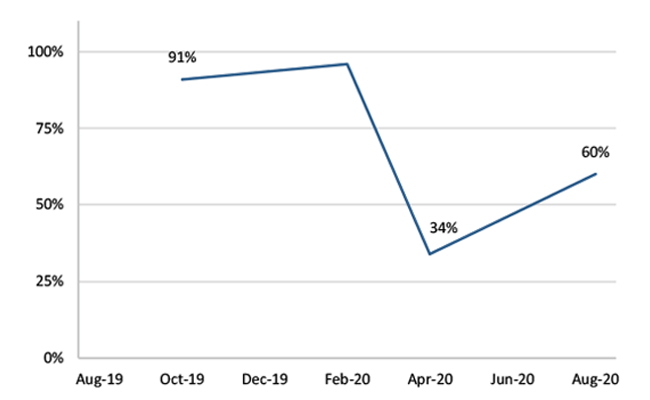
While the increase in CIC shows how overall demand for cash has grown during the pandemic, cash used as a payment instrument has likely declined. The decline in cash used as a payment instrument is influenced by both changes in consumer shopping behavior and merchants steering customers away from cash. To understand changes in respondents’ shopping behavior, both the April and August respondents reported whether they had made any in-person payments within the last 30 days.11 In August, 60 percent of respondents reported making at least one in-person payment, which is a significant increase from the 34 percent of respondents reported in April (Figure 3) but still below the pre-pandemic share of 96 percent. The lower share of respondents making in-person payments likely resulted in a decline in the average number of cash payments.
Figure 3
Share of Participants Reporting In-Person Payments in Previous 30 Days
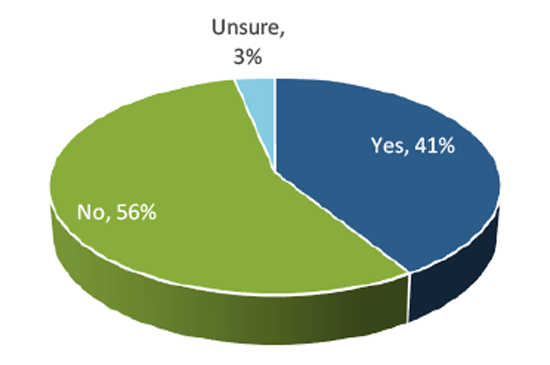
As the share of respondents making in-person payments remains below pre-pandemic levels, the share of respondents making online or over the phone payments for purchases previously made in person increased from 22 percent in April to 41 percent in August (Figure 4).12 The increase in online or over the phone payments continued even as local restrictions were eased or lifted. Cash payments likely declined as a result of fewer respondents making in-person payments, and cash payments could remain low if consumers prefer making payments online or by phone. Whether this current shift to online or by phone payments will persist after the risk of contracting COVID-19 decreases is unknown at this point. It is possible that the pandemic may have accelerated a shift towards online payments and purchases.
Figure 4
Switch to Paying Online or by Phone
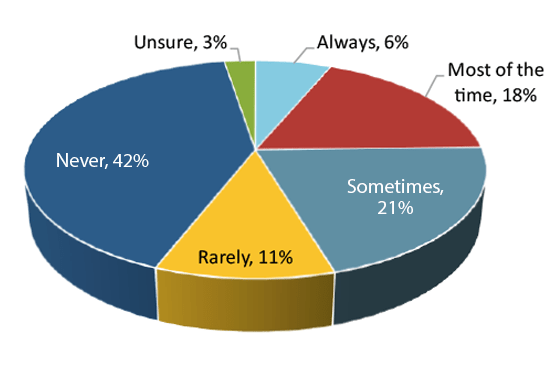
The frequency with which consumers are noticing merchants asking patrons to use cards rather than cash, called steering, has become more common since the start of the pandemic and may be a factor in consumers’ use of cash.13 Of the respondents who made in-person payments, 45 percent reported that a merchant requested that patrons use payment cards at least some of the time, with 24 percent reporting such requests always or most of the time (Figure 5). Merchants appear to engage in steering for two primary reasons, namely, the perception that card payments may be safer for store staff, as card payments do not require any physical interaction between checker and customer. Additionally, card payments reduce the need for coin to settle transactions.
Figure 5
Asked by Seller to use Cards?
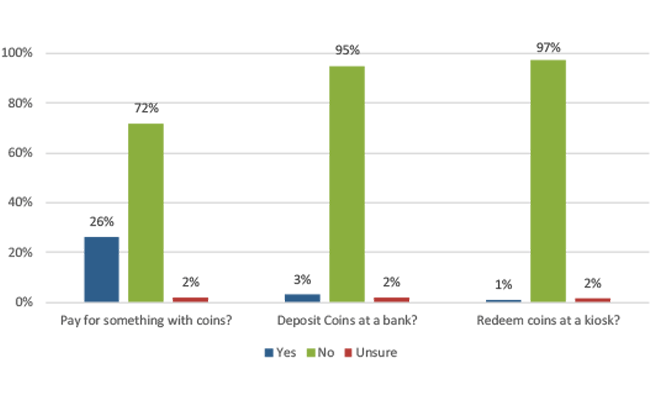
While the coin circulation issue had a limited impact on consumers, respondents were asked about their coin usage in the last 30 days. The data shown in Figure 6 supports the idea that consumers who received coins tended to hold rather than redeem them. Nearly three-quarters of respondents reported they had not paid for anything with coins, 95 percent of respondents reported that they did not deposit coins at a bank, and 97 percent did not redeem coins at a kiosk in the past 30 days. The significant change in Federal Reserve coin receipts and merchants’ perceived decline of coin supply suggests that far more people were using, depositing, and redeeming coins before the pandemic.
Figure 6
In the Last 30 Days Have You Used Coins to…
Conclusion
The August supplemental survey was conducted to capture data on shifting consumer payment behavior throughout the pandemic. While the permanence of these shifts is yet to be determined, this latest survey found that the pandemic substantially increased the use of cash as a store of value, which correlates with the continued increase of currency in circulation. While some respondents have shifted their in-person shopping to online or over the phone, 77 percent of respondents who made in-person purchases did not indicate that they were avoiding or averse to using cash. This, along with the increase in CIC, shows people still rely on cash especially during uncertain times. The pandemic has also disrupted the normal flow of cash and coin through the economy, and this disruption speaks to the importance of a flexible and resilient cash supply chain. How long this pandemic will last, how severe the economic impact will be, whether alternative payment instruments can replace all of cash’s characteristics, and whether consumers will continue to value cash as a payment option have been persistent unknowns throughout the pandemic to date. This uncertainty affects not only cash holdings but also how people are shopping and making payments as respondents and merchants adapt to the current environment. The data gathered for the October 2020 Diary will provide more information on the magnitude of these changes resulting from the pandemic, and future Diary studies beyond 2020 will reveal the permanence—or lack thereof—for these trends. We anticipate publishing findings from the 2020 Diary of Consumer Payments Choice in the spring of 2021.
Note
The project described here relies on data from survey(s) administered by the Understanding America Study, which is maintained by the Center for Economic and Social Research (CESR) at the University of Southern California. The content of this paper is solely the responsibility of the authors and does not necessarily represent the official views of USC or UAS. The collection of the UAS COVID-19 tracking data is supported in part by the Bill & Melinda Gates Foundation and by grant U01AG054580 from the National Institute on Aging, and many others.
Footnotes
1. Additional information regarding the Understanding Study Panel, COVID-19 surveys and data can be found at the USC Dornsife Center for Economic and Social Research website Understanding America Study (usc.edu)
2. Of the 3,016 respondents who participated in the 2019 Diary, 2,605 completed both the April and the August surveys. The results in this paper are based on the responses from the respondents who participated in all three surveys.
3. For a brief yet complete overview of the economic support measures included in the CARES act, see Department of the Treasury’s 2020 Agency Fiscal Report
4. Store of Value holdings from October 2018 shows average holdings for all participants in the 2018 Diary of Consumer Payment Choice, rather than the subset of respondents who participated in all four surveys.
5. The wording in the USC survey was economic stimulus funds, which are referred to in this paper as economic impact payments. See Understanding America Study (usc.edu)
6. USC surveys starting between April 1st and June 24th asked respondents whether EIPs were received within the last two weeks and all USC COVID-19 surveys asked participants whether they received unemployment benefits within the last two weeks.
7. Additional demographic data for survey respondents is available upon request.
8. Respondents living in households making more than $200,000 were not eligible for EIPs.
9. A Guide to COVID-19 Economic Stimulus Relief
10. Statistics from 2,178 of 2,605 respondents are reported, 171 respondents who reported household income exceeding $200,000 in October 2019 were excluded and 256 respondents who received unemployment benefits since the start of the pandemic survey were also excluded. Those who received unemployment since the passage of the CARES Act were not included in a separate analysis as the number of individuals within each group was too small to conduct the analysis.
11. The April survey asked if respondents has made any in-person payments since March 10th, rather than 30 days.
12. Over the phone payments are distinguished from mobile payments.