Download PDF (243 kb)
Download Chart Data (70 kb)
Summary
Since the start of the COVID-19 pandemic, the Federal Reserve’s national Cash Product Office (CPO), Federal Reserve Bank of Atlanta, and Federal Reserve Bank of Boston have collaborated to conduct three supplemental COVID-19 surveys. These surveys were fielded to better understand how the pandemic disrupted consumer payments and shopping behavior. The three surveys were fielded in April 2020, August 2020, and April 2021 as part of the University of Southern California’s COVID-19 longitudinal survey.1 The third supplemental survey took place between April 15th and May 25th and focused on consumer cash holdings, shopping behavior, and coin use. This paper reports findings from the most recent supplemental COVID-19 survey, which finds that the patterns of consumer behavior established in late summer 2020 in response to the COVID-19 pandemic continue to hold true, despite the facts that COVID-19 cases have decreased and that businesses have reopened for indoor and outdoor services in the United States.
The high-level findings from this survey are:
- Consumers continue to hold more store of value cash compared to pre-pandemic amounts.
- Consistent with the findings in the April and August 2020 supplemental surveys, fewer consumers are making in-person payments compared to pre-pandemic levels.
- The share of individuals making in-person payments and using cash in April 2021 declined slightly compared to August 2020.
- Consumers continue to state that they are not affected by coin allocations implemented by the Federal Reserve, and the share of individuals redeeming, or depositing coin remains low.
Overall, the data shows that consumer cash holdings behavior and payment choice continue to deviate from pre-pandemic trends. The average value of store of value cash continued to increase with April 2021 holdings at $325, an increase of approximately $80 compared to pre-pandemic values reported in October 2019.2 3 While average store of value holdings increased, the average value of money consumers held in their pocket, purse, or wallet remained consistent compared to pre-pandemic levels at around $70.
Although overall demand for cash has increased throughout the pandemic, the share of individuals who reported making an in-person payment over the previous 30 days remains well below pre-pandemic levels at 56 percent in April 2021. In addition, of those making an in-person payment, the share of consumers making a cash payment in the last 30 days also declined to 58 percent, down from 73 percent in August.
Fewer individuals reportedly made in-person payments even as Federal Reserve coin inventory levels were declining just as they were in the Spring in 2020.4 Even with U.S. Mint production of new coins, the available coin supply was insufficient to meet order demand from depository institutions due to the continued slowdown in circulation of coin associated with the reduced use of cash in transactions. As a result, the Federal Reserve once again limited coin orders starting in May 2021. Prior to the pandemic, the Federal Reserve received 7-8 coins back in deposits for every 10 coins it paid out in orders. Since the pandemic, the Federal Reserve continues to only receive 3-4 coins back for every 10 coins it pays out. Despite this second round of coin allocations, most consumers continue to experience little disruption when receiving change. Similar findings were reported in August 2020, shortly after the first coin allocation policy was implemented. These seemingly contradictory results may indicate that, while many individuals are not making in-person cash payments and therefore not experiencing issues receiving coin, those who are making in-person cash payments are doing so more often than in August 2020 resulting in greater demand for coin.
Methodology: Supplemental COVID-19 Surveys
To learn about consumers’ responses to the COVID-19 pandemic, the Federal Reserve conducted supplemental surveys by adding between 8 and 12 questions to the COVID-19 tracking survey fielded by University of Southern California. These supplemental surveys were conducted throughout the pandemic to supplement data collected from the annual Diary of Consumer Payment Choice (Diary) studies in October of 2019 and 2020. The supplemental surveys investigated how the pandemic’s extraordinary disruption affected payments, consumers’ cash holdings, shopping behavior, and coin use and circulation. The panel structure of these supplemental surveys meant that many respondents to the October 2019 and October 2020 Diary studies also participated in the supplemental surveys.
Two previous papers that were published by the CPO reported results from the April and August 2020 supplemental surveys.5 The first paper reported results for 2,737 individuals who also participated in the October 2019 Diary of Consumer Payment Choice (Diary) and the second supplemental paper reported results for 2,605 individuals who took part in both the October 2019 Diary as well as the first supplemental survey. However, continuing this same methodology and including only individuals who participated in both the 2019 and 2020 annual Diary studies as well as the two previous supplemental studies would have reduced the panel for this analysis to only 817 participants. This would have excluded more than three quarters of the participants from the final supplemental survey.6 Thus, rather than, excluding such a large number of participants, the data in this paper reports the results for all participants from each survey. As a result, the data reported here differ from previous publications, but it is important to note the overall conclusions reached in the previous papers are not affected.
Table 1: Dates and contents of supplementary surveys and contents
| Survey | Sample | Panel Sample Size | Full Sample |
|---|---|---|---|
| First supplemental survey | Respondents to the 2019 DCPC and to supplemental survey 1 | 2,737 | 6,287 |
| Second supplemental survey | Respondents to the 2019 DCPC, supplemental survey 1, and supplemental survey 2 | 2,605 | 6,238 |
| Third supplemental survey | Respondents to the 2019 and 2020 DCPC, supplemental survey 1, and supplemental survey 2 | 817 | 6,052 |
Acknowledgements
This paper would not have been possible without the support and contributions of the following individuals. From the Atlanta Fed: Kevin Foster, Claire Greene, Marcin Hitczenko, Brian Prescott, and Oz Shy. From the Boston Fed: Joanna Stavins and Ruth Cohen. From the San Francisco Fed: Tom Flannigan, Simon Kwan, and Justin Wray. From the Cash Product Office: Alexander Bau, Benjamin Gold, Jamie Law, Louise Willard, Kathleen Young, and Roger Replogle.
1. Cash Demand Remained High Throughout Pandemic
Since mid-March 2020, the demand for U.S. currency has been unprecedented. The Federal Reserve has provided more than $350 billion in net cash orders paid to banks and credit unions as consumer demand for cash continued to increase throughout the pandemic. To understand how consumer cash holdings and shopping behavior changed throughout the COVID-19 pandemic, the Federal Reserve included questions about cash holdings in each of the three supplemental surveys to augment the data from the annual Diary of Consumer Payment Choice.
Figure 1:
Average Value of Cash Held per U.S. Customer:
Pocket, Purse, or Wallet
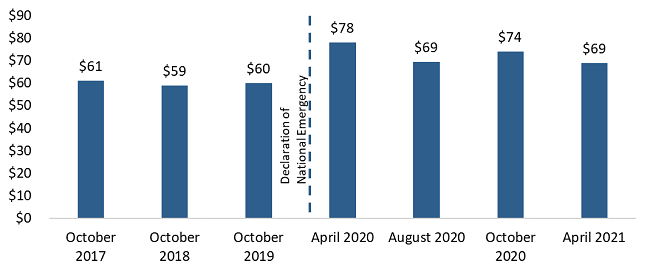
The April 2021 cash holdings data shows two important results. First, there was no significant change in the amount of cash held in one’s pocket, purse, or wallet (on-person cash holdings) as holdings in April 2021 were about $69, unchanged from August 2020 (Figure 1).7,8 Second, store-of-value cash holdings (cash held in one’s home, car, or elsewhere) have continued to increase throughout the pandemic as the average value increased to $326 (Figure 2), an increase of $92 compared to October 2020.9 Since October 2019, store of value cash holdings have increased 35 percent while the value of currency in circulation increased approximately 20 percent.
Figure 2 also shows the results for two different store of value questions; the data points in red show the results when participants were asked to report their cash holdings by denomination and the data points in blue show the results when participants were asked to report their aggregate cash holdings. For each annual Diary study, participants report their cash holdings by denomination. However, due to the limitations of the supplemental surveys, respondents were initially asked to report aggregate cash values rather than a denominational breakdown.
Figure 2:
Currency in Circulation and Store of Value Cash
Holdings by Question Type
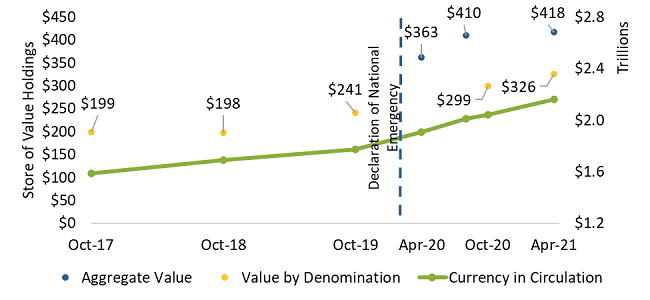
The difference in how participants were asked to report their holdings may have caused the differences in cash holdings between the supplemental data from April and August 2020 and the annual Diary studies. In October 2020, participants reported average store of value holdings to be about $300, a significant decline when compared to the $410 average holdings that were reported in August 2020. This result was surprising especially as the value of currency in circulation continued to increase over that same period. To test whether the participant data entry method was causing the difference or whether store of value holdings declined in October, the April 2021 survey randomly assigned participants to report cash holdings either as an aggregate value or by counting and reporting holdings by denomination.10
The supplemental survey results from April 2021 showed the average value of on-person holdings was $70 when reported in aggregate and $69 when reported by denomination. These values were similar to previously reported holdings in the April and August 2020 supplemental surveys as well as the October 2020 Diary, suggesting the data entry method by participants did affect reported on-person cash holdings.11 However this was not the case when participants reported their store of value holdings. Participants entering aggregate values reported average holdings of $418, which is $92 more than the average holdings of those who reported by denomination.12 Despite this difference, it is not known which method of reporting is more accurate. On the one hand, asking individuals to report the store of value holdings by denomination is burdensome and may result in underreporting. On the other hand, asking individuals to report aggregate values may result in overreporting as respondents may not recall periodically drawing down of their cash holdings. Additional analysis and research will be required to understand these differences. Nevertheless, using the data from either question format, we find that consumers have increased their cash holdings to values above pre-pandemic levels.
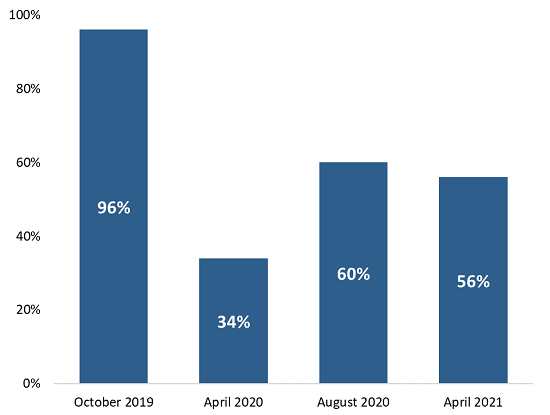
2. As of April 2021, 6 in 10 Consumers Shop In-Person
Throughout the pandemic, the share of individuals making in-person payments has remained well below pre-pandemic levels. In April 2020, only one-third of individuals reported making an in-person payment since early March 2020. However, in-person payments rebounded in August 2020 when the second supplemental survey found the share of consumers making at least one in-person payment in the last 30 days jumped from 34 percent to 60 percent; a similar share was reported in April 2021. These results suggest that the shopping habits developed during the pandemic have been slow to change and continue to deviate from pre-pandemic trends, at least until this point.
Figure 3:
Share of Participants
Reporting In-Person Payments in
Previous 30 Days
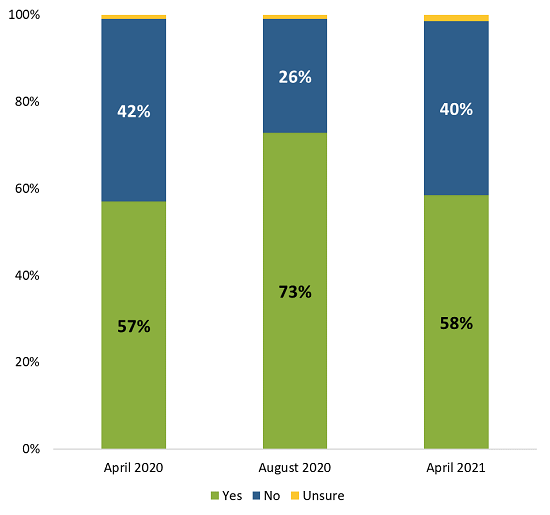
The latest data shows this has been the case for the share of people making in-person cash payments as well. Only 58 percent of consumers reported making cash payments over the last 30 days in April 2021, a similar share reported in April of last year and well below the 73 percent share reported in August 2020 (Figure 4). As discussed in the paper “2021 Findings from the Diary of Consumer Payment Choice”, much of the increase in not-in-person payments took place at grocery stores, sit-down restaurants, and fast-food locations; generally, places where cash use was common before the pandemic. As we await data from the upcoming annual Diary study, it will be interesting to see how consumers make payments at these traditionally in-person merchants and whether cash payments increase compared to data from 2020.
Figure 4:
Use Cash for Any in-
Person Payments?
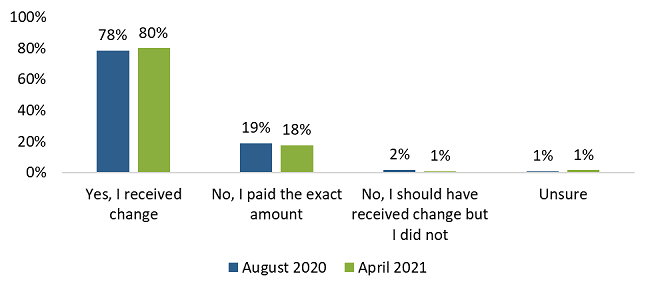
3. Consumers Report Almost No Trouble Getting Change
On May 18, 2021, shortly before the third supplemental survey was completed, limits on coin orders from the Federal Reserve were implemented for a second time. This second round of coin allocations is noteworthy because the consumer survey data does not align as “cleanly” as it did during the first allocations implemented in June 2020. In the summer of 2020, the share of consumers making in-person cash payments had increased relative to the start of the pandemic and this in-turn increased demand for coin. However, it is important to note that the supplemental survey does not contain data on the number of payments consumers made but rather the share of people who are making in-person payments, including cash. Therefore, it is possible that consumers who shopped in-person in April and May 2021, did so more frequently and used cash more often for those in-person purchases, which would increase the demand for coin despite the lower share of people making in-person cash payments compared to August 2020. Even as the circulation of coins remains below pre-pandemic levels and the Federal Reserve again allocated coin orders to banks and credit unions, few consumers report problems receiving change when they use cash, results which remained consistent compared to last August (Figure 5).
Figure 5:
Did You Receive Change When Using Cash?
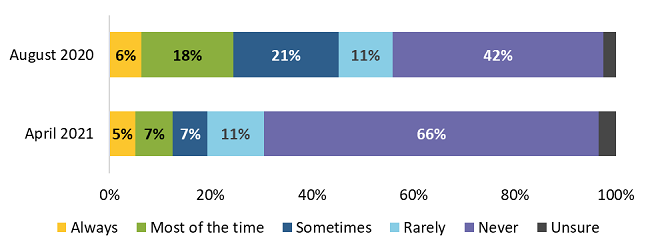
Another reason that people could be making cash payments more frequently is the reduction in merchant steering observed since last summer (Figure 6). Survey respondents were asked how often merchants asked them to use debit or credit cards instead of cash at the in-person point of sale. In August 2020, 45 percent of consumers reported that merchants asked for debit or credit cards at least some of the time,13 and this share declined to 19 percent in April 2021. Also, in April, about two-thirds of consumers reported that merchants never asked then to use cards, up 24 percentage points from August.
Figure 6:
How often did sellers ask to use a debit or credit card
instead of cash?
Therefore, when consumers do make payments in cash and receive change, that change often ends up in one’s car or residence in jars or piggy banks. However, given the limited impact on consumers, there remains little incentive for individuals to use, deposit, or redeem their coins (Figure 7). While consumers reported little disruption in receiving coins, from a supply chain perspective, the Federal Reserve, financial institutions, and retailers have needed to balance how to distribute allocations in as fair and equitable manner as possible.
Figure 7:
In the Last 30 Days Have You…
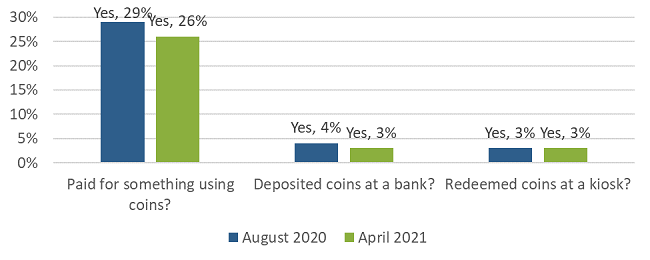
If the share of people making in-person payments remains below pre-pandemic levels, then there is a risk of persistent reduced use, deposit, and redemption of coin that will affect the circulation and available supply for some time. Therefore, assuming the share of people shopping in-person continues at current levels, additional and easier methods for using and depositing coin may need to be considered until a new equilibrium between supply and demand is reached.
Conclusion
The third supplemental survey conducted in April 2021 continues to show that consumer shopping behavior has changed throughout the pandemic. As consumers’ store of value cash holdings increased to $326, an $80 increase compared to October 2019, so too did the value of currency and coin in circulation which reached $2.18 trillion by the end of May 2021. While the demand for cash remained elevated at the time of writing this paper, the share of people making in-person payments remains depressed and even declined slightly from the 73 percent reported in August to at 56 percent in April. Despite fewer people reporting an in-person payment over the last 30 days, the demand for coin continues to outpace supply. Yet the supply issues for coins are not affecting consumers in a significant way as only four percent report depositing or redeeming coin which may continue to limit circulation as consumers have little incentive to put their coin back into circulation.
In general, the data from the third supplemental survey shows that cash holdings, consumer payments, and shopping behavior have not returned to pre-pandemic levels. As the risk from the pandemic continues, it is difficult to determine whether consumer payment behavior will revert to trends akin to pre-pandemic levels. For example, consumers might maintain an elevated level of cash holdings and continue making an increased share of payments online. Or, perhaps, individuals may prefer to shop in-person and spend down their cash holdings rather than shopping online. Regardless of how the pandemic will continue to affect consumer payment behavior, the 2021 Diary of Consumer Payment Choice will be helpful in providing early insight into how payments will continue to evolve.
Appendix:
Diary of Consumer Payment Choice
Developed by the Federal Reserve Bank of Boston’s Consumer Payment Research Center (CPRC) and currently managed by the Research Department at the Federal Reserve Bank of Atlanta, the Diary of Consumer Payment Choice collects data about shopping and payments behavior from a unique, nationally representative survey of consumers administered by the University of Southern California (USC) Dornsife Center for Economic and Social Research.14
The Federal Reserve’s national Cash Product Office (CPO) uses data from the Diary of Consumer Payment Choice (Diary) to understand consumer cash use and anticipate its ongoing role in the payments landscape. The Diary, a collaboration of the Federal Reserve banks of Atlanta and Boston and the Federal Reserve Cash Product Office, is fielded using USC’s Understanding America Study panel, which comprises approximately 9,000 respondents from across the United States.
Supplemental COVID-19 Surveys
The Federal Reserve’s national Cash Product Office (CPO) uses data from the Diary of Consumer Payment Choice (Diary) to understand consumer cash use and anticipate its ongoing role in the payments landscape. Developed by the Federal Reserve Bank of Boston’s Consumer Payment Research Center (CPRC) and currently managed by the Research Department at the Federal Reserve Bank of Atlanta, the Diary collects data about shopping and payments behavior from a unique, nationally representative survey of consumers administered by the University of Southern California (USC) Dornsife Center for Economic and Social Research. USC’s Understanding America Study panel of households comprises approximately 9,000 respondents from across the United States, 6,052 of which completed the 27th wave of the COVID-19 series of surveys.
About the Cash Product Office
As the nation’s central bank, the Federal Reserve ensures that cash is available when and where it is needed, including in times of crisis and business disruption, by providing FedCash® Services to depository institutions and, through them, to the general public. In fulfilling this role, the Federal Reserve’s primary responsibility is to maintain public confidence in the integrity and availability of U.S. currency.
The Federal Reserve System’s Cash Product Office (CPO) provides strategic leadership for this key function by formulating and implementing service level policies, operational guidance, and technology strategies for U.S. currency and coin services provided by Federal Reserve Banks nationally and internationally. In addition to guiding policies and procedures, the CPO establishes budget guidance for FedCash® Services, provides support for Federal Reserve currency and coin inventory management, and supports business continuity planning at the supply chain level. It also conducts market research and works with financial institutions and retailers to analyze trends in cash usage.
References
Coyle, Kelsey, Laura Kim, and Shaun O’Brien. 2021. “Consumer Payments & the COVID-19 Pandemic: The Second Supplement to the 2020 Findings from the Diary of Consumer Payment Choice.” Federal Reserve Bank of San Francisco Cash FedNotes.
Foster, Kevin, and Claire Greene. 2021. “Consumer behavior in a health crisis: What happened with cash?” Federal Reserve Bank of Atlanta Policy Hub.
Foster, Kevin, Claire Greene, and Joanna Stavins. 2021. “The 2020 Survey of Consumer Payment Choice: Summary Results.” Federal Reserve Bank of Atlanta Research Data Report 20–3.
Foster, Kevin, Claire Greene, and Joanna Stavins. 2020. “The 2019 Survey of Consumer Payment Choice: Summary Results.” Federal Reserve Bank of Atlanta Research Data Report 20–3.
Greene, Claire, and Joanna Stavins. 2021. “The 2020 Diary of Consumer Payment Choice.” Federal Reserve Bank of Atlanta Research Data Report 20-4.
Greene, Claire, and Joanna Stavins. 2020. “The 2019 Diary of Consumer Payment Choice.” Federal Reserve Bank of Atlanta Research Data Report 20-4.
Kim, Laura, Raynil Kumar, and Shaun O’Brien. 2020. “2020 Findings from the Diary of Consumer Payment Choice.” Federal Reserve Bank of San Francisco Cash FedNotes.
Kim, Laura, Raynil Kumar, and Shaun O’Brien. 2020. “Consumer Payments & the COVID-19 Pandemic: A Supplement to the 2020 Findings from the Diary of Consumer Payment Choice.” Federal Reserve Bank of San Francisco Cash FedNotes.
Kumar, Raynil and Shaun O’Brien. 2019. “2019 Findings from the Diary of Consumer Payment Choice.” Federal Reserve Bank of San Francisco Cash FedNotes.
Footnotes
1. Additional information regarding the Understanding America Study panel, COVID-19 surveys and data can be found at the University of Southern California Dornsife Center for Economic and Social Research website Understanding America Study (usc.edu)
2. Cash holdings from April 2021 are compared to October 2020 as these values provide a more accurate comparison because of how participants were asked to enter their cash holdings. A more detailed description of how cash holdings were reported is provided in section 1.
3. Participants were asked to report both the value of cash held in one’s pocket, purse, or wallet, which is considered on-person holdings, and cash held in one’s home, care, or elsewhere, which is considered store of value cash holdings
4. In pre-pandemic times, coin inventories generally decline in the early spring decline before increasing throughout late spring. However, during these past two years, deposits have not rebounded which resulted in the Federal Reserve implementing a coin allocation in the spring the last two years.
5. See Consumer Payments and the COVID-19 Pandemic: A Supplement to the 2020 Findings from the Diary of Consumer Payment Choice and Payments and the COVID-19 Pandemic: The Second Supplement to the 2020 Findings from the Diary of Consumer Payment Choice.
6. The large decline in the number of panel participants from the 2020 Diary of Consumer Payment Choice was due to two factors. First, two versions of the 2020 Diary were fielded to allow testing of new and different versions of survey questions. Second, new Diary participants were asked to participate to determine whether previous experience with the Diary affected survey responses.
7. The chart shows the average value by denomination which was truncated at the 99 percent level. The average on-person cash holdings reported by aggregate results was $70 which was also truncated at the 99 percent level.
8. While some portion of these differences may be related to seasonality, order and receipt volume to and from the Federal Reserve suggests the largest seasonality differences are between late November/ early December and late January/ early February. These large swings in volume correspond to increased cash volume related to the holiday season and the subsequent “flowback” of cash to the Federal Reserve.
9. Previous supplemental papers only report results for those who also participated in the October 2019 study.Please see the section “Note Regarding COVID-19 Supplemental Surveys” above.
10. The random assignment was applied for both on-person cash holdings as well as cash stored elsewhere questions.
11. The assumption is this on-person cash isused for making payments or as a backup payment option.
12. Values of cash stored elsewhere are truncated at the 99 percent level.
13. A different version of this question which asked whether merchants refused to accept cash was included in the first supplemental survey in April 2020.
14. See: Federal Reserve Bank of Atlanta’s Diary of Consumer Payment Choice-Federal Reserve Bank of Atlanta and USC’s Understanding America Study.
DATA AND INFORMATION
Survey and Diary of Consumer Payment Choice, Federal Reserve Bank of Atlanta, data, tables, and reports for download.
U.S. Coin Task Force, #getcoinmoving
UNDERSTANDING CORONAVIRUS IN AMERICA
The project described here relies on data from surveys administered by the Understanding America Study (UAS), which is maintained by the Center for Economic and Social Research at the University of Southern California (USC). The content of this paper is solely the responsibility of the authors and does not necessarily represent the official views of USC or UAS. The collection of the UAS COVID-19 tracking data is supported in part by the Bill & Melinda Gates Foundation and by grant U01AG054580 from the National Institute on Aging, and many others.