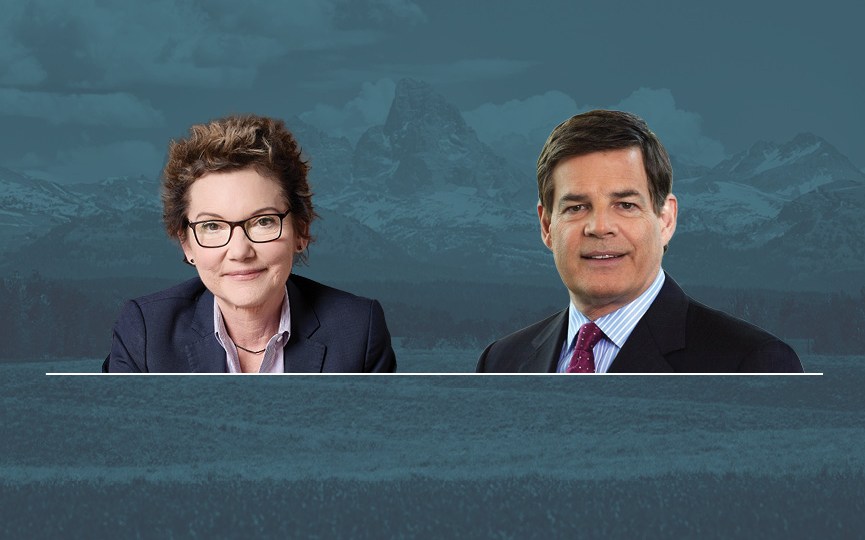
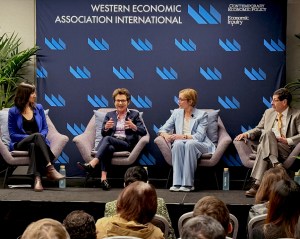
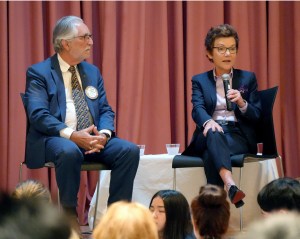
Laura Bakkensen, University of Arizona
Sorting Over Flood Risk and Implications for Policy Reform

Date

Thursday, August 13, 2020

Time

SF 8:00am, NYC 11:00am, BERLIN 5:00pm

Location

Virtual

Laura Bakkensen is Associate Professor at the University of Arizona’s School of Government and Public Policy. Dr. Bakkensen utilizes applied microeconomic and econometric techniques to study the economics of natural disasters, identifying current hazard risks and evidence of adaptation to hurricane damages and fatalities across the globe. Using an interdisciplinary Tropical Cyclone Integrated Assessment Model, Dr. Bakkensen quantifies the impacts of climate and socioeconomic change on disaster losses. Dr. Bakkensen’s research informs policy on insurance regulation, post-disaster aid, hurricane warnings, and public adaptation projects.

Download the paper (pdf, 17 mb)

Download the slides (pdf, 1.8 mb)


Seminar and Q&A recording (video, 56:37 minutes)

Transcript

Hide this section

Laura Bakkensen:

Thank you very much, Glenn and I also wanted to extend a great thanks to all of the organizers of this virtual seminar series. It’s been a wonderful and very interesting seminar series thus far, and I’m very delighted to be able to share my work with this wonderful audience. I also wanted to acknowledge that my co-author on this project, Dr. Lala Ma, at the University of Kentucky. So to kind of set the scene for where we’ll be going today in the talk, obviously talking about flood risk, but where does this fit within the large scope of climate economics? Two weeks ago with Simon Dietz’ talk for those of you who were able to join, we thought about kind of a macroeconomic question of integrated assessment models and how we can use economic tools to the best of our ability is to understand the costs of climate change with balancing with the costs of mitigating climate change, and what’s kind of the optimal balance between that. A month ago, we saw Jim stock, also kind of a more macroeconomic topic, thinking about what is our policy tool set to mitigate these climate emissions and what might some of the different costs and benefits of these tools be. So today I want us to think about kind of the flip side. So thinking about actually the climate damages themselves, so this will be much more of an applied microeconomic paper, but I wanted to kind of lay out some of the key themes, key frontiers of this important area of climate economics. So when we’re talking about climate damages, these are very specifically but broad, any sorts of losses or damages that will be felt due to climate change. Given the amount of climatic change that’s already occurred and the future projections of climate change, it’s very likely that even under strict mitigation scenarios, we still will be feeling some damages and losses from climate change. So this area of research tries to unpack where those damages might be, how sensitive they are to different climate change scenarios. And they often are very bottom-up, data-driven empirical approaches, a vast wide rich literature looking at this. And one of the common themes is this idea of heterogeneity in impacts. So impacts will be felt differently over time, across space, across sectors, and really trying to unpack where the damages will be felt, who and who will be bearing the costs of these climate damages. This is really important both to feedback into the integrated assessment models that Simon Dietz was talking about to see what the optimal path of climate change might look like. But also very importantly, to understand adaptation to climate change. What are the key adaptation steps individuals need to take, policymakers need to take in order to be confronting in mitigating to the best of our ability these climate damages now and in the future. So a key driver of these damages is who’s living in harm’s way? So the focus of the paper I’m going to be talking about today thinks a lot about this location choice decision and an important open question where there’s certainly good research going on is this question of climate migration. How much will we see people moving? More extreme forms might be climate migrants or climate refugees some call them kind of long range interregional or international migration. Let’s take an extreme example of an island no longer existing after sea level rise, where would these people resettle? But migration can also be very local. And so the paper today will look at intraregional scale location choices or decisions. So in the case of flood risk that I’ll talk about today where the risk itself can vary on a very small geographic scale, these kind of careful fine-grained, location choice decisions can really impact who’s in harm’s way, who might bear more of the costs of these potential climate risks, and that would shape the vulnerability of the communities in harm’s way. And then kind of a third theme, this is certainly not an exhaustive list of kind of climate damages economics, but rather key themes that kind of fit with the paper that I’m going to be talking about today are the policy, the policies. In what ways can policies help smooth this transition, help communities and individuals better adapt, and to help us mitigate these potential climate losses. And a key theme in the paper today is thinking about behavioral responses to policies. So policy may be made with very good or best intentions but thinking that people may respond differently to these policies and this can have important implications for both the policy effectiveness and also who might be bearing the costs of implementing these policies. So I think this is going to be another really key theme in both in research and practically for policymakers in the future. So another kind of key questions here are is what is the impact of climate adaptation policy? So we’re going to, I’m going to take a look, look at climate damages very broadly but then today’s focus will be specific to flood risk. So I think the risk of floods and the potential damages don’t need much motivation. We hear about it often in the news but the scale is quite large even currently to flood risks. So in 2019, almost $50 billion in losses around the globe, almost 5,000 fatalities, and about a trillion dollars in direct losses since 1980. Of course there are indirect losses and impacts that can make these numbers much bigger. So, these numbers might look small relative to the COVID-19 crisis right now, but we know that flood risk and flood events are one of the costliest and deadliest types of natural disasters affecting the globe. So, human communities are currently having to cope and respond to these risks. But research is showing that the future risks also might be quite impacted by climate change. Both along the coast a lot of attention has been paid to sea level rise and how this may differentially shape the risk setting, but also inland flood risk. And so, my paper or our paper will address some of this as well where even if… So, one outcome of climate change is likely to be changes in the distribution of precipitation, some locations even if the average level of precipitation doesn’t change, but the variance increases, this means locations may experience more intense precipitation events, and we’ll need to think about how to properly mitigate strategies that have worked in the past. Things like river channelization or other mitigation technologies may not work as well if we have increased duration intensity of precipitation events. So there is very interesting work kind of projecting what future losses may be. And a key thing here is it’s really, the losses will be kind of co-determined by of course, the climatic change and the change to the global atmosphere, but also socioeconomic change as people may develop, get richer, there may be more population density. And so, these both will play a key role. So recent work has shown future losses are expected to increase due to both of these events, but really highlights that mitigation is a key open question. And by mitigation, I both mean mitigation to climate emissions, CO2, and greenhouse gas emissions, but also mitigation of the losses themselves. And then lastly, there are many different policy levers to combat or mitigate flood risk. So today we’ll be looking a lot at insurance and information provision as key policy levers. But an important point here is while there’s a lot of great discussion and should be looking at what new or novel policies we might need in the future to mitigate climate change, the policies we have right now will also likely be quite important, these kind of longstanding institutions and policy levers. So things like the National Flood Insurance Program in the US case will have to shape and continue to grow, and think about how to offer the products that they offer or the services that they offer under a changing climate. And so each of these policy levers may have very different impacts if we get back to the theme of behavioral responses to policy. So understanding these responses, understanding these impacts will really help to mot
ivate and inform what this kind of optimal policy mix might look like in order to try to mitigate climate damage. All right, so now focusing more on the particular study at hand, again, this is a joint work with Lala Ma. And we were really interested in these longstanding calls reform, the National Flood Insurance Program. So for those of you who aren’t as familiar with the NFIP or the National Flood Insurance Program, I’ll have a few slides from now, I’ll give some of the foundational institutional details of the program that are relevant for this study, but this is the major form of insurance in the United States. More than 95% of all flood insurance policies tool are through this program and it’s a publicly provided program. So it’s the federal government that is providing this insurance program. It was started through a mandate in by congress in the late 1960s, and really came into force in the 1970s, and has continued to be enforced since then. So the program itself has been called into, there have been calls for reforms for two key reasons. First of all, there have been large fiscal imbalances in these programs. So for example, after hurricane Katrina and other hurricanes in 2005, the following year, the Flood Insurance Program had to borrow about $16.6 billion from the treasury. And these fiscal imbalances are driven in large part by premium subsidies. So, I might use subsidies or price discounts interchangeably but what I mean by this is that the price charged to some subsets of the policy recipients is lower than what we might think of is actually fair or the expected damages in any given year. So there have been calls to remove these subsidies, bring prices up to at risk levels, and then also critiques of the maps being outdated. So by some accounts, one in six maps may be older than 20 years old. For a risk like flood risk where it may be changing and shifting over time, having access to good information might be quite important. So, these issues with Flood Insurance Program reform and the discussions around reform maybe also added, there may be added complexity if there also is heterogeneous sorting across flood risk. So what do I mean by this? Might different types of people differentially live or not live in high flood risk areas? So just as some very suggestive evidence and I’ll unpack this more throughout the talk, here is our case area. This is the Miami-Dade, Fort Lauderdale, Port St. Lucie combined statistical area. It’s in South Eastern Florida. So here are the Florida Keys, Miami, and then we’d have the Everglades to the west here. And we see here, so here’s flood zone on the left part of the screen per capita income. Right part of the screen and darker quantities here signify higher concentrations of both of these qualities. So we see suggestive evidence of a correlation between flood risk and, or coastal flood risk and income. And we also see a suggestive correlation of inland flood risk and race and ethnicity. In this case, this is fraction of Hispanic residents in these communities. So if there is sorting over flood risk and different types of people may be more likely for whatever reason to move into a high flood risk area, this could have important implications for the effectiveness and the distributional impacts of policy reform. And more broadly, this idea of behavioral responses would have implications for both the efficiency and equity of different climate policy and policy reforms, as well as disaster and climate vulnerability. So the key question in this paper was do we observe sorting over flood risk? And if so, what might this imply for insurance policy reform?

Glenn Rudebusch:

Laura, quick question.

Laura:

Yeah.

Glenn:

And that’s from Rick van der Ploeg. And so you mentioned Desmet, Rossi-Hansberg, others and you get much lower coastal flooding losses of allowances are made for a dynamic economic adaptation in migration. So, how does that fit into your study?

Laura:

Yeah, we are just looking at a static case here, looking at the effects, but we do see some resorting after the policy changes. So absolutely there’s a lot of great work going on in this area and actually a recent general government accountability office report also looks at the potential for migration in climate adaptation. So yeah, I certainly don’t want to be forgetting a lot of the great work going on out there. Great. So a bit more about what we do. We estimate a fairly straightforward, a discrete choice residential sorting model. These sorts of models have been widely applied to literature but we have three kind of novelties to personalize this to the flood risk setting. So to the best of our knowledge, we’re the first to use this to really look at residential sorting specifically across flood risk. And there’s a small but growing literature looking at sorting over climate risk in general, and important future directions as well. So we use a boundary discontinuity design to control for potential correlated amenities. So other things may be correlated with flood risk so we want to make sure when we’re looking at flood risk in particular, we’re able to clean those other variables or factors out of the analysis. We also allow for this heterogeneous sorting by home buyers, so we’re looking at home buyers here, race, ethnicity, and income. And then we try very carefully to account for property-specific National Flood Insurance Program premium subsidies. So this base model will let us know does there seem to be heterogeneous sorting over flood risk? We can then use the model to estimate some policy counterfactuals. So these are simulated effects of a policy change, both the welfare and flood exposure impacts of removing the subsidy. Now, this is not a full cost benefit analysis where we’re just looking at the welfare cost to the homeowners who have to bear the higher insurance premiums. And then lastly looking at the value of flood map revisions. So this will, can have several contributions. First of all, just to better understand how people may choose to live across the climate risk of flooding. Looking at the potential for distributional impacts of hazard insurance reforms. And more broadly, understanding the potential behavioral responses to different climate relevant policy reforms. So, just a preview of our results. So we do find that kind of people are at least somewhat attentive to long run flood risk and we find on average home prices are about 6% lower in floodplains relative to, hypothetically identical house outside of the floodplain. But we also find clear evidence of sorting. So, we find low income and minority residents to be more likely to sort into flood risk. However, the important caveat that we can’t untangle the possible mechanisms. So we think this is a really important area future work and has important parallels with heterogeneity in other types of climate outcomes, like beliefs about climate risk. So, what’s going on is this differential access to subsidies, choice sets, preferences, or beliefs. So I’ll talk a little bit more about this during the yeah, future slides. We also find behavioral responses to be quite important. So as I said before, this is more of a static, some simple model, and assuming that people could kind of costlessly and instantly move. We’ll provide some light to relax that assumption as well but we find that resorting actually could mitigate quite a significant amount of these costs of increased flood insurance premiums, and likely could result in fewer individuals in high-risk flood zones once the subsidies are removed. But noting that even though overall we may see fewer people in high-risk areas, there would be a higher concentration of groups we may think of as more vulnerable, low-income, and minority groups. So this could be an important outcome to keep in mind when thinking about policy reform. And lastly, we do find that the better information to be quite beneficial to households in making better decisions. All right, so just very briefly going over some of the literature, this is not exhaustive, but especially with the lens of how does this relate to climate risk. As I said before, there’s a rich residential sorting value of spatial amenities and disamenities literature that’s being applied, but I think it’s an interesting area for future application of understanding how people are currently understanding and responding to, or current risks and also future climate risks as well. There’s also a rich hedonic literature looking at the capitalization effects. What extent is flood risk and sea level rise risk capitalized? And also looking at learning through particular flood events and how salient these risks might be. There’s also a very interesting literature looking at the impact of, the heterogeneous impacts in disasters themselves. So in terms of migratory responses to disasters and also kind of household credit and finance that again, echoing this theme of heterogeneous impacts. And then lastly, I think important in growing literature as well is just the value of environmental and importantly climate and risk information, to what extent are people responding to this and acting upon it?

Glenn:

Great, Laura, I’ve got one question.

Laura:

Sure.

Glenn:

I’m going to unmute Amin Mossad.

Laura:

Great.

Amin Mossad:

Hi. Thank you very much. This is a great work, I’m really thrilled to follow the seminar. My question is about disentangling the evolution of risk from the evolution of information about risks. So, when FEMA… So actual risk is probably smooth while the NFIP maps are discreet. The sorting at the boundary is likely more a sorting about information on flood risk rather than a sorting on the actual flood risk. And so, I was wondering whether there’s an ability to separate the two, whether it’s an evolution of risk when there is an evolution of the maps, or whether it’s an evolution of the information about the risk?

Laura:

Yeah, that’s a fantastic question. Thank you. And you’re absolutely right. So here, our key setting is about 2009 to 2012. And our underlying assumption is that people really are keying off the official flood insurance information. If these are home buyers, we’re assuming that they’re just kind of taking the official government information as given. This seems at least somewhat reasonable we argue for the time period. This was after hurricane Katrina but before, well, just the tail end was hurricane Sandy. And really a lot of the public scrutiny of flood insurance maps really started on I would argue kind of the 20, at following hurricane Sandy up through today. In addition, there were far fewer alternative products. So the National Flood Insurance Program Flood Insurance Rate Maps were kind of the dominant information source, but we’ve seen a lot more information sources coming online now in some rarely interesting private sources as well. So yes, if to the extent that consumers may be even more attentive that would be really interesting to look at as well. We just use the basic assumption that they’re keying off of this discreet am I in a flood zone? Am I not in a flood zone? And that’s how the information is presented to home buyers typically in real estate markets. But I think that’s a really interesting and important area, especially as we get more information products, how attentive and sophisticated are buyers. So there is some, so, Bernstein, Gustafson, and Lewis have a nice paper looking at differential attentiveness potentially to sea level rise information. So yeah, we definitely are keying off this discrete change in flood risk when, but I think especially in the later 2010s, there could be some really interesting fodder for looking at more sophisticated learning.

Amin:

Thank you.

Laura:

Yeah. Thanks. Okay, so going through some background about the National Flood Insurance Program just make sure we’re all on the same page. As I said by previously this was started by an act of congress due to a lack of a private market beginning in this period, and concerns over mounting flood losses. So, the public program provides flood insurance but also was mandated to ensure affordability. So that’s been an important interesting juxtaposition of tenants that we often wouldn’t see in say a private market for flood insurance. Another important outcome was the development of these Flood Insurance Rate Maps. So these were the official FEMA’s designation of National Flood Insurance Program’s designations of which areas of the US are high flood risk or low flood risk. And the three key categories that we were looking at in this paper are low flood risks. So these are X zones that have less than a one in 100 chance of annual flood. And then high flood risk, so at least one in 100 chance of annual flood. And parsed out into inland flood risks so the A zones with an annual freshwater flood risk. And then the V or VE zone, so think coastal velocity zones with an annual salt water flood risk or coastal flood risk. Now, as I mentioned before, these, while the National Flood Insurance Program are tasked to have risk-based rates, subsidies are available or price discounts, and they can be quite large in some cases. So the three main subsidy channels that we’ll looking at today or we look at in our paper are first the pre-FIRM subsidies. So these were homes built before the first Flood Insurance Rate Map in their community. They have a preferential rate structure since they were older and built before the Flood Insurance Program really got started. Secondly, there’s a community level program, so through the Community Rating System where there can be discounts at the community. And then lastly, there’s a grandfathering where after a map updates homes that have had policies enforced can keep their preferential rates from before the flood map change. So this grandfathering was removed in 2012 during some reforms but then reinstated in 2014 through an act of congress. And then the last important detail for the purposes of the paper are that federal, so homes located in these high-risk A and V zones with a federally-backed or regulated mortgage are required to purchase flood insurance. So while the program overall has been criticized that despite these price discounts, in many cases uptake is low. The newly purchased houses under mortgage, there’s actually a very high fraction that do get flood insurance. So one study found after three years, more than 90% of homes that were recently purchased, some still did maintain their flood insurance. All right and then a little bit about the timeline of the reforms, just to motivate that these are policy-relevant questions. There were calls to reform the program and in 2012, there was with bipartisan support, congress passed the Biggert-Waters Act that phased out some of the subsidies over time. However, phasing out the subsidies did bring costs to people who then had to pay more in their flood insurance policies. These are exactly the type of costs that we’re estimating in the paper today. And so, about two years later, there was bipartisan support to halt or slow down, or eliminate some of the subsidy removals. So that was the Homeowner Flood Insurance Affordability Act. As I said before, grandfathering was reinstated. The removal of subsidies was greatly slowed down or eliminated in certain cases and it even went as so far as to refund some policies over the past few years that had in theory overpaid. So there was a lot of public outcry of those who had to pay higher flood insurance premiums. There’s also been talk under the current administration of who should be paying for flood maps. So that’s an important question so we’ll look at the flip of that, what’s the value of these maps. And overall this idea of the program being fiscally at risk. So a government accountability office still considers it a high-risk program and in 2018, after $16 billion of congressional debt relief, the program still owed the treasury about $20.5 billion in debt. All right, so talking about the data for this particular project, we started with all residential home sales in this Miami-Dade, Fort Lauderdale, Port St. Lucie combined statistical area. It’s about 2.3 million households total although of course not all of them were sold during the 2009 to 2012 time period we look at. We then matched the housing sales data and assessor’s data with a self-disclosed home buyer race and income through the Home Mortgage Disclosure Act information. We then also match these with the property-specific flood zones, their Community Rating System, participation rates, and then their property-specific flood insurance rates. We also mapped them to a nearby flood boundary for our boundary discontinuity design to see how close they are to the nearest flood zone change. We then use the National Flood Insurance Program technical manual to estimate the price of the premiums and also the discounts that they may receive. And then we match with other relevant neighborhood characteristics, neighborhood census data, spatial data, the collusion data, and school quality data. So our final merged sample is just shy of 50,000 homes. Maybe for time, I’ll skip over the details about imputing the premiums and subsidies but we basically match the properties to their specific rate structure in the National Flood Insurance Program manual, and then incorporate any other sort of discounts. And here’s just a zoomed in version with slightly different colors of the flood map I’ve shown you before. And this is Miami. It’s a subset of our area but I wanted to show you that kind of this hot pink coastal band is the V zone, those high-risk coastal areas. The green is the low-risk area but we see what’s quite interesting in this case is there’s also a very large inland flood risk story so that the orange and red is high inland flood risk. These are all at least one in a hundred chance of flooding. So we see there’s a lot of geographic granularity in detail where even street by street, house by house, there is potential for one house to be in a flood risk zone and another to not. And this is driven in part by the substrate in South Florida that happens to be a lot more limestone. So we can see a lot of flooding even if you’re not right next to say, a river or a stream. In interest, a few summary statistics on flood risk and for our sample, and I wanted to highlight that on average, the median discount is about $800 from all of the or, from all of the different types of or sorry, from the average of a median policy. And the total subsidy, the median subsidy can be quite small but there’s a long right tail in this story. So the maximum subsidy that we estimate for our case was, our study sample was about $26,000 per year. This is annual value and a very high fraction. Now this is a vast minority of the policies but there’s a long right tail, as I said before. All right and then a few more just stylized facts to motivate that we may see sorting now that we’re getting into the data for this particular case study. So here are maps. On the left side, we have X zones, so those are the low-risk flood, low flood risk zones. And on the right side we have A zones, these are the higher risk inland flood zones. And this dash line in the middle is the boundary between the zones. And as we move further to the right, we get farther away from this flood zone boundary and the same moving to the left. These are just the average fraction of the average concentration of different neighborhood characteristics normalized to zero at this middle point here. So generally we see that these higher risk flood zones tend to be less White. They tend to be higher fraction Hispanic. They tend to be a little bit less Black and again, I’m not controlling for anything here, these are just the descriptive summary statistics. We’ll do a very careful job of controlling the ful
l model. And they tend to be a little bit more wealthy. So this is really highlighting that there may be sorting again in this story. And then just as a highlight as well, we restrict attention to about a kilometer on either side of the boundary as part of our identification. We want to make sure that other things that may be correlated with flood risk we’re not capturing that in the flood risk estimate. So we restrict attention to just kind of this region right here, and we do perform statistical tests to make sure that other neighborhood and other house characteristics aren’t systematically changing across this flood risk discontinuity. And I’ll just briefly go over a few hedonic results for those of you who might be interested in these. So here our dependent variable would be the annual rental rate and we see that even in these hedonic estimates, we have a negative and significant coefficient. So all else equal homes in high flood risk areas will rent or would sell for less so than homes in lower risk areas. And as we’re adding in lots of controls, one of the key controls we’re worried about is the amenity value of living nearby water which is highly correlated with flood risks. So we layer in a lot of controls to try to control for that. We say that the closer you are to the coast, the more expensive the homes are on average. And then column four is kind of our full boundary discontinuity design in a hedonic model restricting attention to just a kilometer from the boundary and find our estimate there. We also test other boundaries and find that these results are, they’re pretty, they’ll hold very well. So that gave us confidence under one kilometer estimate. And lastly, rerunning the hedonic model, ignoring the price supports, we find that the flood risk coefficient is no different than zero. So, really highlighting the importance of being attentive to the potential for price discounts and the prices paid specifically by different households. All right, so a little bit more about the model. As I said before it’s a fairly straightforward, discrete choice residential sorting model. However, we added a boundary discontinuity design. We’re allowing for sorting over flood risk and also the property specific flood insurance premiums in order to kind of tailor this model to the flood risk setting. The model assumes, kind of models the decision making of somebody deciding where to live. And so, we define this choice, this choice set, of where people might live as a combination of the census tract, different flood zone pricing characteristics that we would need to determine the subsidies available. And also some of the coastal amenities, things like distance to coast. So all across of our study area there are about 2,500 choices in any given year. We assume households will pick a choice to maximize utility based on their preferences for both the attributes of the choice, the neighborhood attributes, and also the cost of living. And as I said before, allow for heterogeneity in this by race, ethnicity, and also income quintiles. And then assuming a distribution for the idiosyncratic tastes parameter, we can estimate this using maximum likelihood. So just another quick note about our identification concerns, there were two main ones in our study. First, we were concerned that unobserved neighborhood factors, as I said before, things like coastal amenity value, could be correlated with flood risk or flood zones. So we tried to include careful controls in co-variants to kind of control for or clean out any of these correlated amenities. And also by using this boundary discontinuity design under the assumption that other amenities may tend smoothly across this boundary, whereas flood risk has this discrete change, then we can try to decouple the flood risk with the correlated amenities. And then the second identification concern is the classic price endogeneity concern. So we use an instrument that it’s a BLP style instrument that was applied in this sorting setting by Bayer and Timmins, 2007. So we use this very similar press instruments as well. All right, so, jumping into our main model results, here they are. So, our base group is low income White individuals and we find that they are willing to pay about $700 per year to avoid flood risk. But we also find heterogeneity in this, there are in the classic interpretation of the sorting model, they are willing just to pay estimates. However, we caution the interpretation only as preferences as there could be many other things going on. But how we would interpret then these heterogeneous preferences would be to add any given coefficient onto this base estimate. So for our black home buyers, it would be negative 710 plus 220, so, roughly $500 per year willingness or ability to pay to avoid flood risk. So, instead of focusing as much on the point estimates, what are kind of the general findings here? Firstly, we find this, we define heterogeneity in sorting. So, the minority community, so Black and Hispanic home buyers relative to our White and Asian home buyers, so we find them to be more likely to move into these higher risk flood areas. We also find a large variation in gradient across income. So higher income people all else constant in theory would be less likely to sort into high flood risk areas. So this is kind of our basic finding. Yes, there is evidence of sorting over flood risk. And groups we may think of as more vulnerable are at least based on these results, more likely to move into these high-risk areas. Again, I do want to make the connection here. We’re not studying climate change directly in this paper, however, these would have very important implications for potentially other sorts of climate amenities or disamenities, and more work where we think is needed to try to unpack who might be moving, where people might be moving, ’cause this is going to have a really important consequence for expected climate damages. And again, I do want to highlight, we can’t unpack what is the underlying mechanism that usually everybody is very interested in this as am I as well. And I think more research is really important in this area to understand really what’s going on here. Is this differential beliefs? Differential access to information? Is this remnants of historical or even current housing discrimination? Is there differential learning? We can’t tell from this particular study but we think that this was a really important question. And I would say an important question, kind of in the broader climate damages literature of who and why different groups of people, we may observe them making different choices or able to make different choices. So I will say one mechanism we do clearly see is an income mechanism but controlling for income we also do find some differences across other groups. All right.

Glenn:

I’ve got a couple of questions if possible.

Laura:

Great. Yeah, please.

Glenn:

One that I’m going to ask directly from Sharif Arondean. Does the sorting differ by zone, A versus V?

Laura:

Yes, it does. In our model, we just look at, we kind of group it all together. The V zone is actually a very, very small part of the story even though we think a lot about coastal flood risk and it’s a very important piece. It’s a very small fraction of the… It’s a small fraction of our sample which is reflective of the distribution of properties in this area. But yes, we do, we do see a differential sorting. And I’ll show a few in a few slides differential responses by different zones as well.

Glenn:

Great and Richard Toll wanted to ask a question.

Richard Toll:

Hello, can you hear me?

Laura:

Yes, thank you.

Richard:

Hi and I may just be jumping ahead of you but it is of course also true that what we see for all sorts of reasons, is that people of the same ethnicity tend to cluster together in a particular neighborhood, how does that relate to your finding of sorting by ethnicity, and could that be partial explanation of this?

Laura:

Yes, that’s a great question. So I didn’t show it here but one of the neighborhood attributes is the racial and ethnic composition. So, we are accounting for that. So we’re using 1990 levels to try to pick a point before our case study period to not have contamination or have, for identification purposes we include that. So yes, we do find some kind of homophilic or homophily findings. But again, I think you’re absolutely right. What were the origins of these differences? I think that’s a really important question but for the practical purposes for our model, we are including that as a neighborhood characteristic. Yeah. Great. All right. Thank you. So now the second part of this talk is the policy counterfactual. So, with our main sorting model, we can then run some counterfactual scenarios to look at kind of the distributional impacts and overall costs of potential policy reform. So first I’ll talk about the price reforms. So, in particular, removing the Pre-FIRM, CRS, and grandfathering. And then I’ll look at the information reform. And just to kind of give a lay of the land of what’s actually happening right now, many of the Pre-FIRM subsidies are actively being removed even after the 2014 reforms. The grandfathering was removed, as I said before, but is now re-instated by an act of congress. So there in the near term, it is unlikely to go away. And in terms of the Community Rating System, the CRS, there really are no discussions to remove this program or remove this price discount. But we thought it would just be interesting to include it in here as well but for kind of near term purposes, I think the Pre-FIRM and grandfathering results are probably most policy relevant immediately. So again, we look at just a partial equilibrium, compensating variation, definition of welfare. So we’re not looking at any additional price changes that may occur after if there is resorting that occurs after these initial policy price changes. So just suggestive or kind of snapshots given these assumptions is how I would interpret the results. And again, a note that this is not a full cost benefit analysis. We’re merely looking at the costs to the residents of these policy reforms. There would be many benefits, potential benefits to society from reforming the programs that I’m not going to address here. All right, so looking first at removal of the Pre-FIRM and CRS, here is a graph of our results. So these are welfare changes as a percent of income and I note here that these are all negative numbers. And so the zero axis would be really at the top of this graph. So these are all losses by of course, removing the price discounts, people have to pay more. But we find that overall, the removal is a bit costly. So, about $200 per year per household on average, a broad average. But the price impacts on aggregate level would hit higher income individuals more but scaled by income, we find that lower income individuals would bear a higher cost of these reforms. So, under the affordability mandate or tenant of the National Flood Insurance Program, this might be an important thing to keep in mind. And there’s a lot of interesting work going on on kind of ways to potentially reform the program that could ensure affordability, but also give this risk signal through the pricing that it’s more expensive to live in a high-risk area that we might want to be looking at. So things like premiums, at risk premiums, and then coupled with maybe a means-based subsidy regardless of where you live. So you still would get the price signal that it’s more expensive to live in a high-risk area or more risky to live in a high-risk area. And then here are our simulated results. I don’t want to put too much weight on the point estimates of these percent changes in the distribution of population, but rather some kind of qualitative findings from these results. So this is after the policy reforms. If flood insurance was truly risk-based then how we may see resorting occur. So again, this is costless instantaneous resorting, so kind of a best case scenario. Likely the numbers would be smaller than this ’cause it would be more costly for people to resort and they may just bear the cost of the higher flood insurance premiums for some time. But overall, we see going from the higher risk A and V zone into the lower risk X zone, we see an exodus or a movement from the high-risk to the low-risk area. So overall, we may expect to see, kind of in the long run, fewer people living in these high-risk Areas. However, we also see heterogeneity in where they’re living or who might move, who might be more likely to move to a low-risk area depending on race, ethnicity, and income. So we see higher income people would be more likely to move and also White home buyers would be more likely to move. So this kind of qualitative finding that we may see fewer people in harm’s way but the people who remain it might be important to pay attention to as they may be more vulnerable to these flood risks. And then grandfathering a very similar story where we see at least scaled by percentage of income, the reforms could be thought of as regressive where the welfare costs would be more born by lower income individuals. And then lastly talking about the flood map revisions. We use a value of information calculation here, and the idea is people would be using the flood map information to make, to whatever extent that they’re attentive to it, to make the best choice for themselves about where to live. Now, if the information is old or wrong, they would be making the bet thinking that they’re making the best decision when they’re really making the decision based off old information. So we look, we calculate exactly that, what decision would they be made, would they make based on the old information compared to the decision they would have made had they known the correct decision, the correct information? And then can compare the welfare cost that way. And interestingly, here we find the opposite. So here welfare changed, these are all positive numbers. So the zero axis is at the bottom here and here is average income in thousands of dollars going from zero to 250,000. And we see as again, as a fraction of income, these flood map updates and improvements are more progressive, better informing low income individuals. All right, so what does this mean on aggregate on mass? So again, this is not a full welfare calculation but rather showing the cost to individuals of these welfare, these price reforms. So, removing Pre-FIRM and CRS subsidies on aggregate for our combined statistical area, again, Miami-Dade, Port St. Lucie, Fort Lauderdale CSA, about $143 million per year. This is kind of a best case scenario assuming of course that costless and instantaneous movement. And similarly with grandfathering about $209 million per year for the CSA. Now, if we want to relax that assumption, let’s take the other extreme where people can’t resort, there’s no behavioral response to these policies, policy changes, we would have about a $774 million per year cost to no resorting. So we see overall resorting or the behavioral responses to the policy change can have a large impact on the cost born by individuals. But overall, either way these still are fairly significant costs. And this really, I think helps inform the policy process of reforms as well. So, there may be a reform that is welfare increasing for society as a whole, but if policy makers, as we saw in the 2012 Biggert-Waters Reforms, there was a lot of public outcry over exactly these types of costs born to communities that eventually led to major reforms in the 2014 Homeowner Flood Insurance Affordability Act of congress. So, again, kind of understanding these costs might be quite important to understand the political feasibility of future reforms, both to the Flood Insurance Program, but also more broadly to climate risks in general. So these distributional costs are important both from an equity perspective and also from a political feasibility perspective. All right, so in sum ’cause I want to make sure to leave time for discussion
and questions.

Glenn:

I did have one question.

Laura:

Yeah, please do.

Glenn:

From Perry Viter. What happens to the properties that people move out of of they aren’t abandoned? What about the welfare effects of people moving into them?

Laura:

Yes. So, we would have just a very simple model here. I think that’s an excellent question. There’s a lot of questions about what the supply side, what would happen to existing housing? And of course we’re not also including future changes to flood risks, so things like sea level rise, what’s going to happen? So I think that’s a really important question. We kind of assume that away here.

Glenn:

Okay.

Laura:

Yeah. All right. So just a few final thoughts and again, through this lens of climate risk, what are some kind of insights and themes, and directions for future research? I think one large theme is to what extent are individuals attentive to and responding to climate risks now, and how will that attentiveness shift in the future? As I said before, there’s a lot of very interesting work going on in this area. How does attention maybe heterogeneous, so different groups of people, maybe differentially attentive or able to respond to these risks? This has important equity and also efficiency implications. And likely to really shape climate damages, the potential to shape climate damages in the future. But still highlighting that in this case, policy reforms are likely to have large, potentially large benefit to cost ratio. So, we actually, I forgot to say, we did do a welfare, full welfare calculation or approximation for the flood risk map updates and found under conservative estimates, at least like a 2.5 to one benefit to cost ratio that flood map provisions for our particular case. Of course, the age of the flood maps and the change in risk distribution will really inform how beneficial new maps would be. But this question of doesn’t mean we don’t want to be making climate policy but just try to be attentive to a lot of these pieces. and especially these behavioral responses to the pieces as well. And then lastly, this question, I think a really critical and important theme that’s already come up in the comments is this question of information, what information is out there? How are people interpreting it, understanding it, acting upon it. So I think that’s going to be another important area for the climate risk and climate damages literature that will continue to be important as climate changes in the coming years and decades as well. So I’ll stop there and open it up for questions and comments.

This seminar is part of the Virtual Seminar on Climate Economics series hosted by the Federal Reserve Bank of San Francisco and is open to everyone interested in research on the economics of climate change.