Events
Monetary Policy Insights Panel with Mary C. Daly
Jun 22
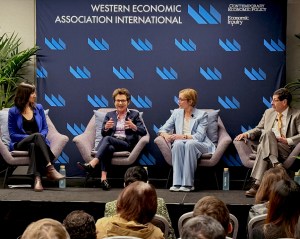
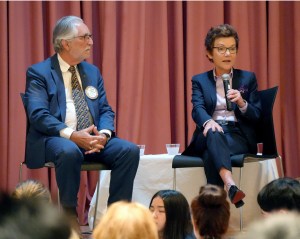
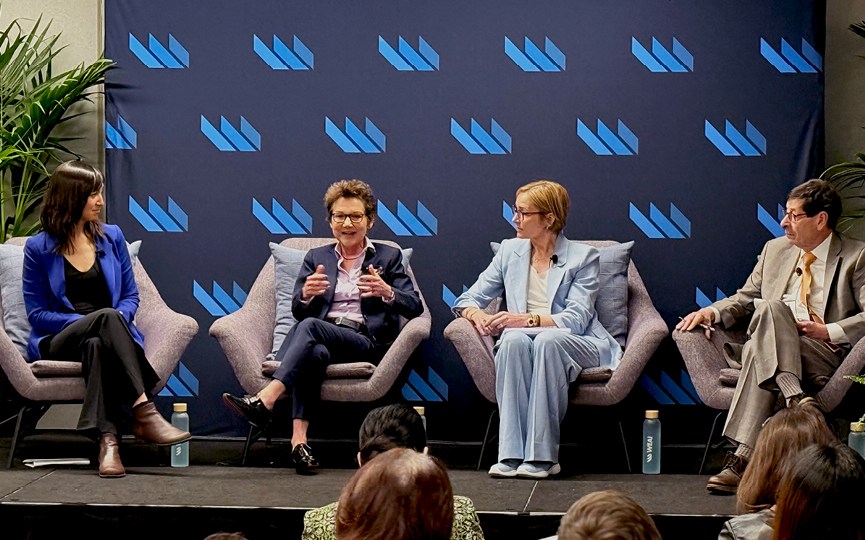
President Daly participated in a monetary policy insights panel at Western Economic Association International’s 100th Annual Conference with John Bates Clark Medal recipient Emi Nakamura, University of California, Berkeley, and Morgan Stanley Chief Economic Strategist and Global Head of Thematic and Macro Investing, Wealth Management Ellen Zentner.
Event Highlights