The Twelfth District includes the nine westernmost states and has some of the nation’s leading technology centers. Over the past several years, robust growth among information technology (IT) firms has fueled gains in output, employment, and earnings and helped the District economy expand more rapidly than the rest of the nation.
- IT in the Twelfth District
- IT contributions to growth in the 1990s
- Slowing in the IT sector
- Impact on District growth
- Spillovers to other sectors
- Summary
Regional Report. The Regional Report appears on an occasional basis. It is prepared under the auspices of the Financial and Regional Analysis Section of the FRBSF’s Economic Research Department.
The Twelfth District includes the nine westernmost states and has some of the nation’s leading technology centers. Over the past several years, robust growth among information technology (IT) firms has fueled gains in output, employment, and earnings and helped the District economy expand more rapidly than the rest of the nation. Recently, however, economic conditions among technology firms in the U.S. have weakened considerably, with many announcing earnings shortfalls and employment reductions. As a result, employment growth in the Twelfth District has slowed substantially, converging with that of the rest of the U.S. This Economic Letter reviews some of the recent trends in the IT sector and examines their effects on District employment growth. As the Letter shows, a key dimension of the current IT slump is the simultaneous decline of both the manufacturing and services sides of the sector.
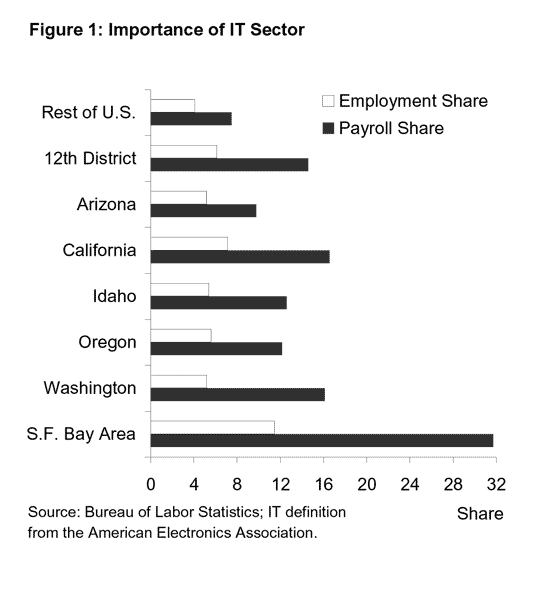
Whether measured by the amount of venture capital invested, number of patents issued, dollar value of exports, or employment and payroll, the Twelfth District has many of the nation’s top technology centers. Not surprisingly, then, developments in IT are of central importance to the District economy. Figure 1 displays employment and annual payroll in IT manufacturing and services as a share of total nonagricultural employment and payroll in 2000. The IT sector includes manufacturing and services firms producing computers and office equipment, consumer electronics, communications equipment, electronics components and accessories, semiconductors, industrial electronics, photonics, defense electronics, electro-medical equipment, communications services, and software and related components.

The figure shows that the share of employment associated with the IT sector is larger in the Twelfth District than in the rest of the U.S. IT accounts for about 6% of total nonagricultural employment in the District, compared to about 4% in the rest of the U.S. Measured by employment, the District is about 1.5 times as dependent on IT as the rest of the U.S.
The importance of technology to the District is even more apparent in the payroll shares (wages, salaries, and benefits), where relatively high salaries paid to IT workers boost its value to the economy. Nearly 15% of District nonagricultural payroll comes from the IT sector, compared to less than 8% in the rest of the U.S. Thus, measured by payroll, the IT sector is about twice as important in the Twelfth District as in the rest of the U.S.
Within the District, California, especially the San Francisco Bay Area, and Washington stand out as areas with very strong IT presences. About 7% of employment and 17% of nonagricultural payroll in California come from tech sectors; in the Bay Area, the shares are 11% and 32%, respectively. IT also is important in Washington, particularly as a contributor to payroll; Washington’s tech sector accounts for about 5% of total private sector employment, but about 16% of nonagricultural payroll. Among all Twelfth District states, only Alaska, Hawaii, and Nevada have relatively less IT employment and payroll than the rest of the U.S.
IT contributions to growth in the 1990s
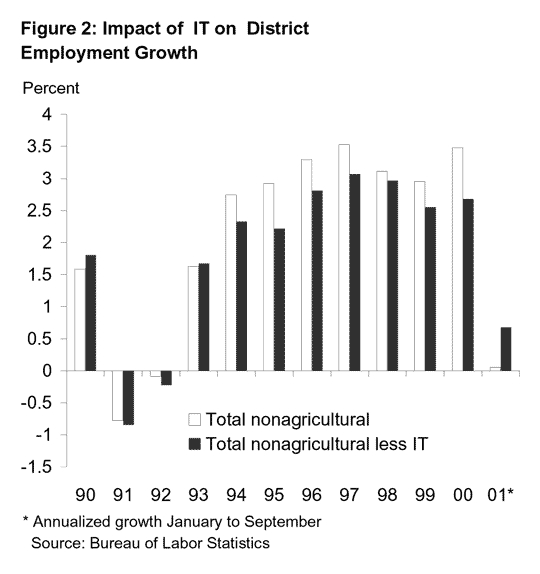
Between 1995 and 1999, business investment in IT goods increased at an average of 20% per year, fueling rapid growth in output, employment, and earnings among technology companies. Because of the high concentration of IT activity in the West, the Twelfth District economy benefited directly from this surge in IT investment. To quantify the direct impact of the IT sector on employment growth, Figure 2 shows nonagricultural employment growth in the Twelfth District, both with (white bars) and without (black bars) the SIC industry groupings containing the vast majority of the District’s technology firms (i.e., SIC 35, 36, 38, 73, and 87). As the figure indicates, between 1990 and 1993, the technology sector contributed modestly to the pace of employment growth in the District. In 1994, however, growth in IT-related sectors began to make significant contributions to the District’s pace of expansion. Although the amount of the contribution varies from year to year, between 1994 and 2000 technology-related sectors boosted total nonagricultural employment growth in the District an average of 0.5 percentage point. The direct and indirect boost given to the District by IT-intensive industries helped the District economy expand more rapidly than the rest of the U.S. over the period (not shown).

Following more than five years of double-digit growth, business investment in IT products and software has slowed substantially this year, damped by uncertainty in the national economy, the dot-com and telecommunications crash, and overinvestment by businesses in IT goods. The abrupt slowdown in business investment in IT has had a noticeable impact on orders, shipments, and production among technology firms. So far this year, new orders of IT manufactured goods including semiconductors, computers, and communications gear have declined by nearly 15%; shipments of these goods also have fallen, dropping by about 5% compared to the same period last year. By comparison, growth in both orders and shipments of IT manufactured goods averaged 15% in 2000. As a result, many firms have found themselves with excess inventories and unutilized production capacity, resulting in declines in output and employment in these sectors.
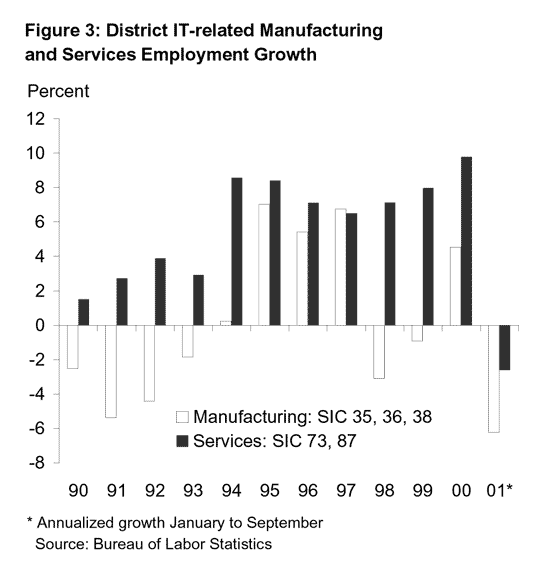
Although production-related adjustments in the IT sector occur periodically, the depth and breadth of the current downturn have proven to be larger than expected and greater than in past cycles. One indication of the magnitude of the downturn is the decline in District employment in IT-related industries. Figure 3 shows employment growth in these sectors over the past decade. As the figure indicates, during the 1990s fluctuations in IT-related manufacturing employment growth were common. In the current slowdown in IT manufacturing, however, the adjustments are more abrupt and deeper than usual. Moreover, during the 1990s, downturns in IT manufacturing were partially offset by rapid growth in non-manufacturing technology firms, which has not occurred this time. The dot-com contraction and a falloff in business investment in software have resulted in net job losses in the District’s business services sector so far this year.

The prominence of the IT sector combined with the deep and broad downturn it has experienced have significantly damped District employment growth, turning the climate from good to bad in just a few months. For example, in 2000, employment in the District increased by 3.5%, with job gains continuing through the end of the year. Growth slowed significantly in the early months of 2001, but remained positive; employment increased by 0.8% during the four months ending in April. Conditions then deteriorated substantially, with District employment falling by 0.5% at an annual rate during May through September. Overall, the pace of employment growth in the District has swung 3.4 percentage points so far this year, putting employment growth in the West in line with the rest of the U.S. for the first time since the last recession.
Although the District economy likely would have slowed along with the national economy, the slump in the IT sector has intensified the downturn. Using the comparisons of employment growth with and without the technology sector shown in Figure 2, one can get a sense of the effect the IT downturn has had on the swing in growth. In the absence of the technology-intensive industries, the District economy would have expanded by 0.7% at an annual rate during the first nine months of this year, rather than by the 0.1% pace actually recorded. Combined with the fact that without the IT sector employment in 2000 would have increased by 2.7% rather than 3.5%, the swing in growth absent IT-intensive industries would be 2 percentage points rather than 3.4 percentage points. These simple calculations highlight the importance of the technology sector to the dynamics of employment growth in the District.
Another way to see the impact of the IT shock is to compare economic conditions across regions in the District with and without large concentrations of IT firms. Developments in California, the District’s largest state, illustrate the role that the IT downturn has played on recent employment trends. In the San Francisco Bay Area, where the value of payrolls at IT (manufacturing and services) firms account for 32% of the value of total payroll in the region, employment growth dropped from 4.7% in 2000 to -2.6% in the four months ending in August, a swing in growth of more than 7 percentage points. Moreover, as of August, the Bay Area had lost jobs for six consecutive months. In contrast, in Southern California, where high-tech firms account for less than 10% of total payroll, the deceleration has been much less pronounced. Total nonagricultural employment grew by 0.9% during the three months ending in July, down from 3.3% in 2000.
Ongoing employment reductions among technology firms have begun to spill over to other sectors of the economy. Softening markets for new office and industrial space have damped growth in construction employment this year, with payroll jobs actually declining in the second and third quarters. Employment among providers of shipping, trucking, and warehousing services also fell in recent months, as firms scaled back in response to slowing demand.
Although growth remained positive in other sectors in the third quarter, in general it proceeded at a slower pace than earlier in the year. For example, employment growth in retail and wholesale trade slowed to 0.5% at an annual rate in the third quarter, down from 1.5% in the first quarter and 2.7% in 2000. The recent sluggishness in the trade sector reflects ongoing reductions in business investment and slower retail sales. Similar deceleration was evident in the finance, insurance, and real estate sector, with job gains slowing from a 3.5% average annual pace in the first quarter to a 0.5% pace in the third quarter.
The Twelfth District economy has slowed substantially in recent months, as the downturn in technology has progressed and spread to both IT manufacturing and services firms. The breadth and intensity of the cutbacks among District IT firms has begun to drag down employment growth in other sectors. The general impact of the technology-driven downturn is particularly evident in the District’s high-tech centers. For example, the San Francisco Bay Area has lost more than 30,000 jobs in the past five months, as both tech and non-tech employers have scaled back. In general, the technology-driven downturn has dramatically altered the regional pattern of growth in the District this year, with last year’s fastest-growing areas either contracting or moving laterally.
Mary Daly
Senior Economist
Opinions expressed in FRBSF Economic Letter do not necessarily reflect the views of the management of the Federal Reserve Bank of San Francisco or of the Board of Governors of the Federal Reserve System. This publication is edited by Anita Todd and Karen Barnes. Permission to reprint portions of articles or whole articles must be obtained in writing. Please send editorial comments and requests for reprint permission to research.library@sf.frb.org
