
The Twelfth District’s extraordinary expansion ended abruptly in 2001, as the downturn in the information technology (IT) sector and the September 11 terrorist attacks combined to damp employment growth in nearly every District state and end the West’s reign as the fastest growing region in the nation.
Regional Report. The Regional Report appears on an occasional basis. It is prepared under the auspices of the Financial and Regional Analysis Section of the FRBSF’s Economic Research Department.
The Twelfth District’s extraordinary expansion ended abruptly in 2001, as the downturn in the information technology (IT) sector and the September 11 terrorist attacks combined to damp employment growth in nearly every District state and end the West’s reign as the fastest growing region in the nation.
This Economic Letter puts the current downturn in the region in perspective in several ways, including placing it in the context of broader U.S. trends and examining conditions in the District as a whole, as well as by state and by selected sectors. We also note that the impact of this downturn is quite different from the last national downturn in 1990-1991. That episode sowed the seeds of a long and difficult contraction for California, but for many other states it only damped growth and never halted their expansion. In the current downturn, California seems to be taking only a modest hit, while some other states are enduring contractions in employment for the first time in nearly 20 years.
The Twelfth District economy weakened considerably in 2001 (see Figure 1), shedding jobs at a 0.6 percent pace, which is about the same pace as the rest of the U.S. Within the District, only Alaska, Idaho, and Nevada recorded job gains in 2001, and only Alaska increased its pace of expansion from 2000 to 2001.
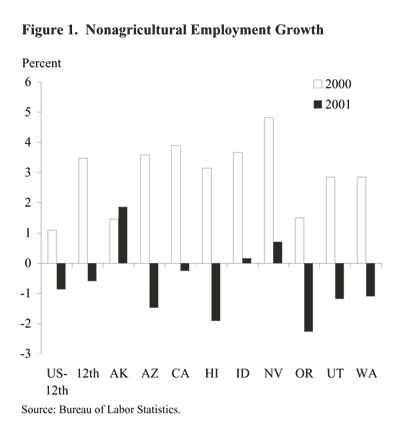
The pattern in 2001 stands in stark contrast to the rapid pace of growth recorded in most District states in 2000, with the change in growth ranging from -3.5 percentage points (in Idaho) to -5.1 percentage points (in Arizona). For the District as a whole the drop was -4 percentage points, more than double that for the rest of the U.S. Overall, the District went from being one of the fastest growing regions in the U.S.—regularly posting growth as much as a percentage point faster than the U.S. average—to being somewhere between average and below average. Moreover, after nearly a decade of having an average of five states among the nation’s top ten in terms of employment growth, the District ended 2001 with only Alaska in that category.
Changing profile of the downturn
The District’s economic downturn began as a relatively confined and focused deceleration, driven primarily by declines in the IT sector. The events of September 11 quickly changed this profile, ensuring that the focused downturn would turn into a broad-based contraction touching nearly every sector and state in the District. Figures 2 and 3 show the annualized percent change in employment in selected District sectors and all District states, respectively, for the early stage of the recession (2001:Q2 and Q3) and the later stage of the recession (2001:Q4) The broad sectors are one-digit SIC classifications. IT manufacturing is a constructed category that includes two-digit SIC categories containing most of the District’s high-tech manufacturers. Business services is a subset of total services and includes many of the IT software and computer and data processing firms in the District.
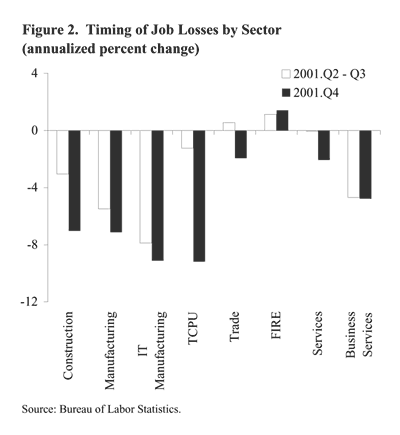
As Figure 2 indicates, employment in IT-intensive manufacturing fell at an 8% annual rate during the second and third quarters of 2001, with the pace of job cuts accelerating during the year. Business services, including IT services, also felt the effects of weakening business investment. Employment in business services declined at a 4.5% annual rate from March to September of 2001.
Given the prominence of IT firms in the District economy, the slowdown in the IT sector quickly spilled over to damp growth in other District sectors, most notably trucking and warehousing and commercial construction. TCPU payrolls, which include transportation, communications, and public utilities, fell by 1.2% at an annual rate during 2001:Q2 and Q3, as the drop-off in shipments of high-tech and other manufactured goods damped demand for these services. District construction payrolls fell by approximately 3% at an annual rate during the second and third quarters, driven largely by declines in commercial office and industrial construction.
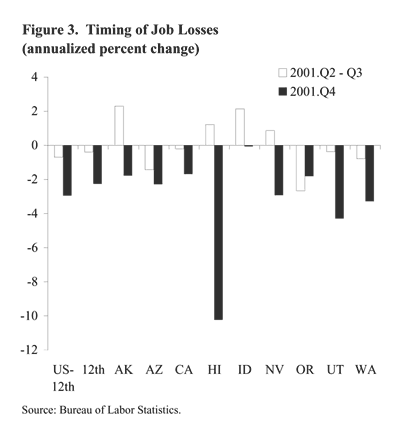
The IT directed downturn in the early part of the recession is evident in the state pattern of employment losses in the District (Figure 3). Early job losses were confined mostly to states more dependent on IT firms. In Oregon, where IT manufacturing firms account for a relatively large share of both employment and payroll, total employment contracted by 2.7% at an annual rate during the second and third quarters, making Oregon one of the weakest states in the nation during this period. (See Daly 2001 for a detailed discussion of the importance of the IT sector to District states.) Arizona, another state with a significant high-tech manufacturing presence, posted a slightly smaller decline, contracting by about 1.4% at an annual rate from March 2001 to September 2001. California and Washington also contracted during the period, albeit at a more modest pace. (See Daly and Furlong 2002 for a more detailed analysis of the recession profile in California.)
The profile of the District downturn changed significantly in the fourth quarter, as the fallout from September 11 worked its way through the economy. Those events created considerable uncertainty among both businesses and consumers, resulting in pronounced job losses in a wide range of sectors, and accelerated job losses in sectors that already had been contracting (Figure 2). For example, construction payrolls declined at a 7% annual rate in the fourth quarter compared to a 3% annual rate in the second and third quarters. The pace of employment cuts also accelerated in manufacturing, driven by additional cutbacks among IT firms and significant declines in employment in commercial aircraft production.
Adding to these losses were job cuts directly associated with the aftermath of September 11. For example, the District’s TCPU sector, which includes air transportation, lost jobs at a 9.2% annual rate during the fourth quarter, as airlines and airline service industries laid off large percentages of their staffs. The District’s trade and services sectors also shed jobs rapidly in the fourth quarter, cutting employment at an estimated annual average rate of 2%. Job cuts in these sectors occurred, in large part, among District retailers, hotel operators, and other travel and tourism services.
As the sectoral composition of the recession changed, so did its regional pattern (Figure 3). Although the pace of job loss accelerated in nearly every District state following September 11, some states were hit harder than others. For example, in Hawaii and Nevada, where travel and tourism expenditures account for about 30% of gross state product, fourth quarter employment losses averaged -10% and -3% at an annual rate. Nevada appears to have fared somewhat better than Hawaii in part because it is less dependent on air travel and on international visitors. In Washington, job cuts at Boeing as well as continued deterioration in the IT sector pushed the pace of job cuts to -3.3% at an annual rate, compared to -0.8% during the second and third quarters. In the remaining District states, declines were relatively broad-based and similar to the District pattern shown in Figure 2. Fourth quarter job losses in these states ranged from -0.1% in Idaho to -4.3% in Utah.
District contraction in perspective
Although the District economy clearly was hit by a recession of about the same magnitude and character as the rest of the U.S., it is important to put the effects in perspective. Figure 4 shows total nonagricultural employment growth in the Twelfth District less California, California, and the rest of the U.S. since 1983. Two points are worth noting. First, relative to 1990-1991, the current recession in the U.S. outside of the Twelfth District likely will turn out to be mild and of short duration. The same characterization holds for California; in contrast to the deep and lengthy downturn in the early 1990s, it has held up better than the U.S. this time, largely due to economic strength in the southern part of the state.
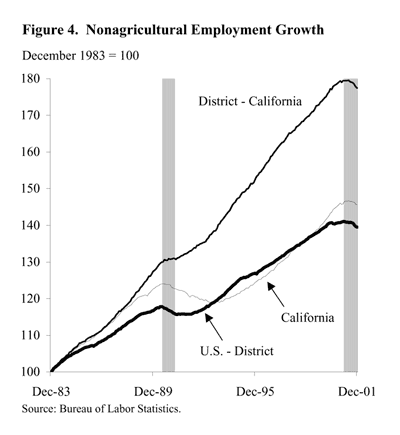
For District states other than California, the opposite is true. For nearly 20 years, the District outside of California had been expanding. Even the national recession in 1990-1991 exacted a relatively modest toll, damping the pace of employment growth for a short period but never pushing the area into a contraction. Moreover, this pattern held for every state except Oregon, which did turn down moderately during the 1990-1991 U.S. recession. Comparatively, then, most District states are doing far worse during this recession than they have done since the early 1980s.
Second, although the U.S. expansion during the 1990s was extraordinary, growth in the West was even more remarkable, well above the pace for the rest of the U.S. While few expect the U.S. or the District economy to repeat such extraordinary growth in the near future, most believe that the sectors driving growth during the 1990s (for example, IT, biotech, and communications) will be among the growth leaders in coming years. This puts the West in a good position to regain its place among the fastest growing regions in the U.S. once the recovery takes hold.
Mary Daly
Senior Economist
Lily Hsueh
Regional Analyst
Daly, Mary, and Fred Furlong. 2002. “Profile of a Recession—The U.S. and California.” FRBSF Economic Letter 2002-04 (February 22).
Opinions expressed in FRBSF Economic Letter do not necessarily reflect the views of the management of the Federal Reserve Bank of San Francisco or of the Board of Governors of the Federal Reserve System. This publication is edited by Anita Todd and Karen Barnes. Permission to reprint portions of articles or whole articles must be obtained in writing. Please send editorial comments and requests for reprint permission to research.library@sf.frb.org