The possibility of a “bubble” in house prices has received considerable attention lately. To be sure, house price appreciation has been strong in spite of the slowdown in the economy.
- House price dynamics
- The unusual strength of the housing market
- How far would house prices have to fall?
- References
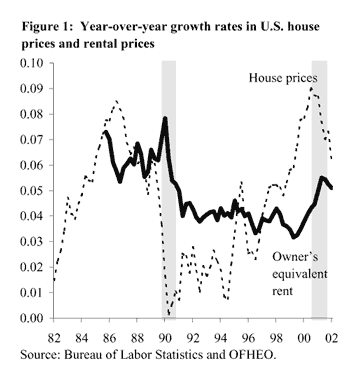
The possibility of a “bubble” in house prices has received considerable attention lately. To be sure, house price appreciation has been strong in spite of the slowdown in the economy. From the beginning of the recession in the second quarter of 2001 through the third quarter of 2002, house prices rose at an annualized rate of 7%, according to the Office of Federal Housing Enterprise Oversight (OFHEO). By contrast, in the comparable period around the last recession in 1990-1991, house prices rose at a more modest 2% annualized rate.
A key concern about a house price bubble is that gains in housing wealth–either unrealized gains or gains extracted through home sales or refinancing–may be partly responsible for the relative strength in consumer spending. If a bubble exists, and it bursts, causing home prices to fall, then an important prop for consumption would be gone.
A house price bubble can be defined simply as a deviation of the market price from the fundamental value of the house. The definition implies, however, that identifying a bubble as it is developing will not be so easy, since the fundamental value of a house is generally unobservable. In this Economic Letter, rather than trying to identify deviations from a fundamental value, I will adopt two different strategies to evaluate house prices. The first is to compare the recent price appreciation with the behavior of house prices in similar stages of past cycles. In this analysis, I show that house prices continued to grow much later into this business cycle than in the early 1990s cycle. The second strategy assesses whether house prices are high relative to their underlying rental value. This analysis shows that house prices are indeed high relative to rents, but that only mild declines in house prices and average growth in rents would be necessary to restore their long-run relationships.
One important stylized fact of the housing market is that changes in house prices display strong persistence. It is widely thought that a lack of persistence is one of the hallmarks of an efficient market. It is not surprising then that persistence in house price changes is usually explained by appealing to the frictions in real estate markets. Real estate markets do not clear immediately after a shock to the economy. It takes time for buyers and sellers of existing houses to search for each other. And it takes time for developers to bring new houses to market after an increase in demand and to work off inventories when demand weakens.

The second interesting feature of the house price data is that it is unusual to observe declines in nominal prices. In the national data in Figure 1, we do not observe any nominal declines in year-over-year price changes over the past 20 years. While real price declines are more common, and some local markets even experience nominal declines, actual transaction prices tend to increase during good times and then flatten out during bad times. A possible explanation for this is that houses serve as both an investment and a consumption good. If the state of the economy worsens, but homeowners can still make their mortgage payments, then they can continue to live in the house and delay selling until a more favorable time. This point is relevant to our current environment. If the housing market weakens, then it is more likely that we will see large declines in the volumes of sales and not necessarily large declines in prices.
The unusual strength of the housing market
House price appreciation over the past several quarters has been high, despite the recession and the moderate recovery. This strength contrasts with the behavior of the housing market in the early 1990s when prices essentially leveled off just as the economy headed into recession.
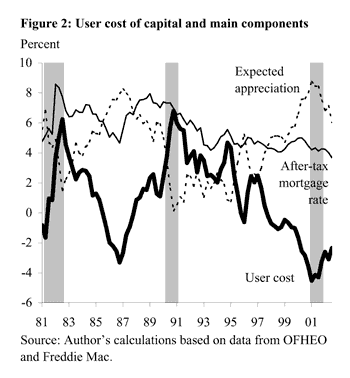
We can see the unusual strength of house prices in two ways, each of which helps shed light on the housing market’s behavior during the recent cycle. First, since supply is relatively fixed in the short run, we can use a measure of housing demand, the user cost of housing capital, to gauge why demand has been so strong over the past few years. The user cost can be interpreted as the cost of investing in one more unit of housing for one period. We will focus on a stripped-down version of the user cost that includes the after-tax mortgage rate and the expected house price appreciation, the two components affecting the cost of ownership that fluctuate most over time. High interest rates raise the user cost, and thus reduce demand. High expected capital gains reduce the user cost, and thus increase demand, as capital gains on housing represent a form of saving.

Figure 2 shows that the user cost is extremely low (negative) at this point in the business cycle. To be sure, the rapid fall in interest rates over the past year has brought down the after-tax mortgage rate. But an even more important driver of the user cost today is the expected appreciation rate on housing assets. Demand–and, along with it, presumably, house prices–has been strong during the recent downturn primarily because house prices are expected to rise in the future.
This result raises the question of how expectations are estimated. I estimate expectations of next quarter’s appreciation rate with the four-quarter moving average of past house price appreciation rates. While this approach is crude and not particularly appealing from a theoretical viewpoint, it is not a bad predictor of actual house price changes. This is because there is so much persistence in quarterly house price changes.
The optimism about house prices in the user cost calculations could reflect several things, including, of course, a bubble. But a non-bubble explanation could be that people expect lower interest rates or robust income growth in the future. The main point, then, is that if house prices are to be justified by fundamental variables, then it is the expectations about these variables, and not the current values, that explain the strong demand at this point in the business cycle.

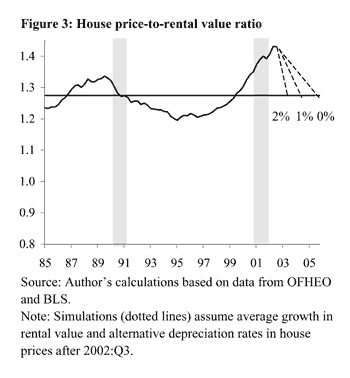
A second way to gauge the extent to which house price appreciation has been unusual is to look at the relationship between house prices and the value of the service flow generated by owner-occupied housing. An indicator of that service flow is the owners’ equivalent rent series, which is published by the Bureau of Labor Statistics (BLS). Figure 3 plots the ratio of the OFHEO national house price index to the BLS’s owners’ equivalent rent index. The horizontal line at 1.27 is the long-run average of the ratio. Note that a decline in this derived ratio below the average level does not necessarily indicate declines in the level of house prices. Rather, declines in the ratio denote periods where rental values are growing faster than house prices. This derived ratio is an attempt to construct a measure akin to the P/E ratio so commonly used in stock market analysis (see Leamer 2002). While we believe that house prices and service flow values should be related, the stability of this relationship is a matter of some debate. That is, large and long-lived deviations of this series from its average are not sufficient proof of mispricing or a bubble. However, if there were indeed a bubble in the housing market, we might expect to see signs of it in the historical house price/rental value ratio.
As Figure 3 demonstrates, house prices rose faster than rental values over the past few years, in sharp contrast to the pattern in the 1990-1991 cycle. With the rise in house prices relative to rental rates in recent quarters, the house price/rental value ratio has moved above its long-run average, suggesting that house prices are indeed high relative to rents.
How far would house prices have to fall?
One of the convenient features of the house price/rental value ratio in Figure 3 is that it lends itself nicely to simulations. Therefore, we can answer the question of how far prices have to fall in order to force the house price/rental value ratio back to its long-run average. An instantaneous correction would require house prices to fall by 11% to restore the long-run relationship between house prices and rental values. However, such an abrupt correction would be unprecedented for the U.S. house price series. Following the observation that declines in nominal house prices are unusual, I hold the house price index fixed at its current level and allow the rental price index to grow at its average quarterly rate (approximately 1% per quarter). Under this scenario, the house price/rental value ratio reverts back to its average level by the fourth quarter of 2005. This scenario implies a period of flat prices for three years, which is not remarkably different from the five years of slow appreciation in the early 1990s.
Alternatively, we can look at scenarios where nominal house prices decline (-1% per quarter and -2% per quarter) and rental values grow at their average rate. Under these scenarios, the house price/rental value ratio reverts back to its long-run average by the first quarter of 2004 and the third quarter of 2003, respectively.
In summary, the house price/rental value ratio does not indicate that house prices are drastically out of line with their historical relationship with rental values. Relative balance in the housing market could be restored without the kinds of declines observed in the NASDAQ or in Japanese property markets during the early 1990s.
John Krainer
Economist
References
[URLs accessed February 2003.]
Krainer, J. 2002. “House Price Dynamics and the Business Cycle.” FRBSF Economic Letter 2002-13 (May 3).
/economic-research/letter/2002/el2002-13.pdf
Leamer, E. 2002. “Bubble Trouble? Your Home Has a P/E Ratio Too.” UCLA Anderson School Forecast Quarterly Forecast Journal.
Opinions expressed in FRBSF Economic Letter do not necessarily reflect the views of the management of the Federal Reserve Bank of San Francisco or of the Board of Governors of the Federal Reserve System. This publication is edited by Anita Todd and Karen Barnes. Permission to reprint portions of articles or whole articles must be obtained in writing. Please send editorial comments and requests for reprint permission to research.library@sf.frb.org