California’s labor market has not yet shown much sign of recovery from the recession that began in 2001. As in the rest of the nation, employment has been flat to down, the unemployment rate has remained at elevated levels, and the jobless are facing increasingly lengthy spells of unemployment.
- California unemployment in context
- Unemployment duration and job loss
- Implications for UI policy
- References
Regional Report: The Regional Report appears on an occasional basis. It is prepared under the auspices of the Financial and Regional Research Section of the FRBSF’s Economic Research Department.
California’s labor market has not yet shown much sign of recovery from the recession that began in 2001. As in the rest of the nation, employment has been flat to down, the unemployment rate has remained at elevated levels, and the jobless are facing increasingly lengthy spells of unemployment. To address the national unemployment problem, the federal government recently renewed legislation that provides extra weeks of Unemployment Insurance (UI) benefits to unemployed workers who have exhausted their regular UI benefits. The impact of this legislation will vary not only across states, but also across regions within large states, according to their unemployment rates and the duration of unemployment spells. In this Economic Letter, I use data from the monthly national household survey to assess the depth of California’s state and regional unemployment problem and the extent to which the UI extension addresses it.
California unemployment in context

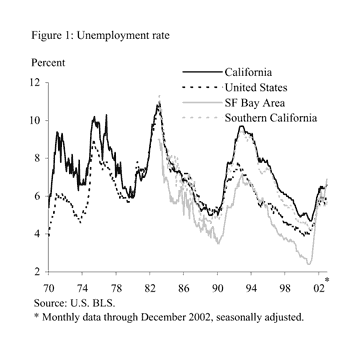
For most of the last 30 years, California’s unemployment rate has been higher than that in the U.S. as a whole (Figure 1). This is due in large part to the state’s sensitivity to past economic shocks: during the recessions of the early 1970s and early 1990s, the unemployment rate rose more in California than in the nation as a whole and remained at elevated levels for several years. These two recessions had not only a cyclical component but also an important structural component in California, which was due to the adverse impacts of federal defense spending cuts on the state’s aerospace industry. By contrast, the early 1980s recession had a limited structural component for the state, so California’s unemployment rate tracked the national rate very closely in the 1980s.
Since the latest recession began in 2001, California’s unemployment rate has increased by about the same amount as the national unemployment rate. Within the state, the increase in unemployment has been largest in the San Francisco Bay Area, where the plunge in demand for tech products has hit hard; unemployment has risen by about 4 percentage points, twice that observed in the state or the nation. Within the Bay Area, the impact has been most severe in the San Jose metro area, where unemployment hovered around 8% (not seasonally adjusted) at the end of 2002—a startling increase from the low of 1.3% recorded at the end of 2000. By contrast, in Southern California, which has a relatively diversified economy, the unemployment rate has increased only by a little over 1 percentage point. Although unemployment rates in the two regions have converged (Figure 1), the burden of rising unemployment has been shared unevenly within the state.
Unemployment duration and job loss
Unemployment duration refers to the amount of time that an individual remains unemployed, and it typically increases during cyclical downturns (Valletta 2002). Families whose wage earners experience lengthy unemployment spells often face reduced spending and consumption levels, which reduces household well-being. Moreover, if unemployment spells are widespread and lengthy, the resulting decline in spending can reduce the momentum of an economic recovery.

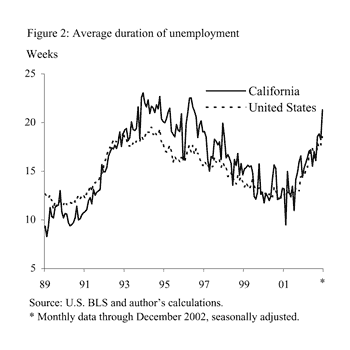
Figure 2 compares unemployment duration for the U.S. and California. Estimates of U.S. unemployment duration are based on data from the Bureau of Labor Statistics’ (BLS) Current Population Survey. Based on these data, the California Employment Development Department releases estimates of state unemployment duration; however, the state estimates are in the form of 12-month averages, which precludes straightforward comparison to figures for the nation as a whole. Therefore, I use the underlying monthly household survey data for California to estimate measures of unemployment duration and the share of unemployment due to job loss in California (data available online beginning in 1989). The monthly tabulations for California presented here are based on a smaller sample size than is typical for official BLS series, but these tabulated series exhibit reasonable month-to-month stability. I applied the standard BLS seasonal adjustment to each of the California series used here. In addition, I use the average duration of in-progress spells—i.e., the duration for individuals who are still unemployed. Although this does not correspond exactly to the average duration of completed spells, the in-progress series is more readily available and commonly referred to in the media, and it is highly correlated over time with a monthly measure of average completed duration (Valletta 2002).

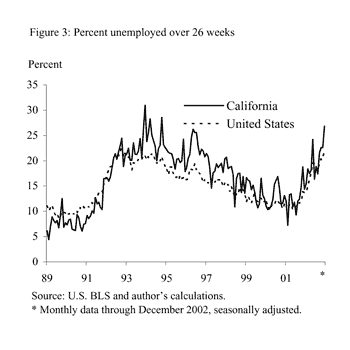
Average duration moves in tandem with the unemployment rate, with California seeing higher durations than the nation as a whole during much of the 1990s, when the state unemployment rate exceeded the national rate. Since the end of the 1990s expansion, however, the average duration of unemployment in California has largely tracked that in the nation (with the exception of a jump in the California series in the latest month). A similar pattern is evident for the share of in-progress spells that have lasted at least 27 weeks (Figure 3). This series is especially relevant for evaluating the impact of the recent extension of UI benefits beyond the normal 26-week exhaustion point.
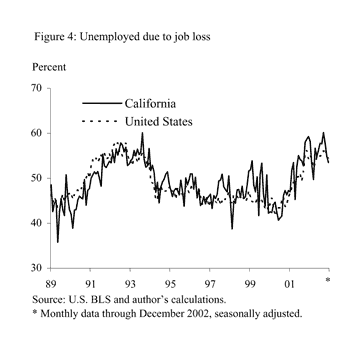
Figure 4 displays the percentage of unemployed individuals who lost their jobs (other reasons for unemployment include labor force entrance and voluntary quits). The pattern of this series is similar to the pattern of unemployment duration (Figures 2 and 3), because variation in the incidence and impact of job loss is one of the main cyclical and secular determinants of changing duration (Valletta 1998). Although the California series is somewhat noisy from month to month, the figure shows that the pool of unemployed has been slightly more heavily weighted toward job losers in California than in the rest of the nation in recent years, including the last few years of the expansion that led up to the 2001 recession. Overall, these figures suggest that California faces an unemployment problem that is about as severe as the national problem.

Consistent with the larger jump in the San Francisco Bay Area’s unemployment rate, I find evidence of higher job loss and longer unemployment duration there than in Southern California. (Although the sample size from the household survey is too small to compute regional figures on a monthly basis, use of all twelve monthly surveys for 2002 yields sufficiently large sample sizes.) In particular, in 2002 the share of job losers in unemployment was 12 percentage points higher in the Bay Area than in Southern California (64.3% versus 52.2%), the average duration of unemployment was about 1-1/2 weeks longer in the Bay Area (18.9 weeks versus 17.3 weeks), and the share of unemployment spells of 27 weeks or more was nearly 4 percentage points higher in the Bay Area (23.5% versus 19.8%). These differences in unemployment duration are not large, but the higher share of job losers in the Bay Area implies a significantly higher rate of UI claims, since UI benefits in general are restricted to job losers.
Although California’s current unemployment problem is not much different from the nation’s, differences in unemployment duration within the state have implications for current national policy on unemployment insurance. UI payments function as an “automatic stabilizer” of the economy, temporarily bolstering the purchasing power of the unemployed and maintaining economic activity in areas with excessive unemployment. On January 8, 2003, the U.S. Congress approved President Bush’s request for a renewal of the Temporary Extended Unemployment Compensation Program (TEUC), which extends the normal 26-week limit on receipt of UI benefits. This renewal continues funding for the TEUC that began in March 2002 and expired in December 2002. The TEUC and related legislation provide for an automatic 13-week extension of UI eligibility in all states and for a second 13-week extension in “high unemployment” states. Qualification for the second extension is determined by either of two triggers: an unemployment rate for UI-covered individuals of at least 4%, or an overall unemployment rate of at least 6.5% (combined with an increase of at least 10% over values from recent years). California qualified for the second extension for only a short time in 2002. Californians who exhausted their regular UI benefits (up to 26 weeks) after March 2002 can claim an additional 13 weeks of UI benefits, while those who exhausted benefits on their first extension between April 7 and July 6, 2002, were able to claim a second 13-week extension.
Because California’s unemployment rate and duration structure is not that different from the nation’s, the UI extension is likely to apply to similar shares of unemployed individuals in California and in the nation. However, as suggested by a higher share of job losers and longer unemployment durations, the Bay Area’s UI-covered unemployment problem is somewhat more significant. In 2002, nearly one out of every four unemployed workers in the Bay Area had been unemployed for at least 27 weeks, with similar numbers likely this year. Many of these individuals probably have received or will receive the first 13-week UI extension. On the other hand, many others may remain unemployed for longer than 39 weeks, yet they are not eligible for the second 13-week extension because eligibility is based on statewide conditions.
If the Bay Area were a state, its population would place it as the 13th largest nationwide, and it likely would be eligible for UI benefit expansions beyond those in most of the rest of the state. California faced a similar dichotomy in the early 1990s, when unemployment in Southern California was more severe and persistent than in the Bay Area. Although evaluating and applying UI extension rules at the local level probably is too expensive from an administrative standpoint if conducted nationwide, application of local triggers for major metro areas in large states (such as California, Texas, New York, and Florida) might be manageable. In the meantime, few Bay Area residents qualified for the second UI extension under existing rules, and the associated lack of income for unemployed individuals is likely to hold down the area’s economic recovery going forward.
Rob Valletta
Research Advisor
References
Valletta, Robert G. 1998. “Changes in the Structure and Duration of U.S. Unemployment, 1967-1998.” FRBSF Economic Review 98-3, pp. 29-40.
Valletta, Robert G. 2002. “Recent Trends in Unemployment Duration.” FRBSF Economic Letter 2002-35 (November 22).
Opinions expressed in FRBSF Economic Letter do not necessarily reflect the views of the management of the Federal Reserve Bank of San Francisco or of the Board of Governors of the Federal Reserve System. This publication is edited by Anita Todd and Karen Barnes. Permission to reprint portions of articles or whole articles must be obtained in writing. Please send editorial comments and requests for reprint permission to research.library@sf.frb.org