The question in the title arises from looking at the ratio of patents issued to dollars spent on research and development (R&D). Patents often are thought of as the fruition of R&D spending and as measures of technological progress.
- Are patents and R&D closely related?
- Have the legal or bureaucratic environments changed?
- Has the propensity to patent changed?
- Has the quality of patents gone up?
- Conclusion
- References
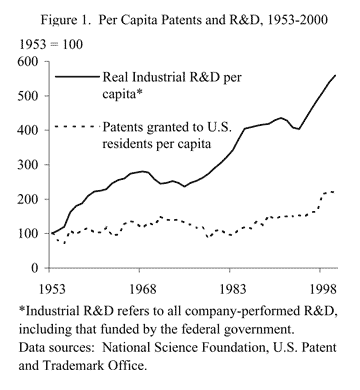
The question in the title arises from looking at the ratio of patents issued to dollars spent on research and development (R&D). Patents often are thought of as the fruition of R&D spending and as measures of technological progress. As Figure 1 shows, from 1953, the first year the National Science Foundation began collecting data on R&D, to 2000, real R&D per capita grew 3.7% a year on average, while patents granted to U.S. inventors per capita grew only 1.7% a year on average.
Do these data suggest that patents, and perhaps innovative ideas themselves, are becoming harder (more costly) to obtain? Are we in a period of “technological exhaustion,” where there are diminishing returns to innovative effort? If we are, then we also may face an eventual slowing in economic growth and in the rate of improvement in living standards, since technological progress is key to long-run sustainable growth in our living standards.
The good news is that we may not have to throw in the towel on technological progress just yet. In particular, the declining ratio of patents issued to R&D spending need not indicate technological exhaustion if the two are not that closely related. For example, the number of patents may be determined by non-technology factors, such as patent office staffing and budgets or the legal environment. In addition, the economic incentives to patent may have deteriorated over time, leading to a decline in firms’ propensity to seek patents for their innovations. Finally, it could be that patents per R&D dollar are declining because firms are seeking higher value patents that require greater research costs; thus, the total value, or quality, of patents per R&D dollar actually could have remained constant or even increased over the last half century.
This Economic Letter discusses the available evidence on each of these possible explanations for the decline in patents per R&D dollar.
Are patents and R&D closely related?
The first step in exploring the divergence between R&D spending and patents issued is to evaluate the strength of their relationship. Unfortunately, it is exceedingly difficult to do so using the available time-series data for two reasons. First, the lag between when R&D is conducted and when the fruits (i.e., patents) of the research are achieved can be long and variable. Second, the other ingredients, such as the legal environment, that affect patents and that one would like to control for are very hard to measure over time. One approach that gets around some of these difficulties assesses the “average” (or more ambitiously, the “equilibrium”) relationship between R&D and patents by taking their averages over a sufficiently long period (as long as the lag between the R&D spending and the granting of a patent) and looking at how these averages covary over a cross-section of regions or industries. Ideally, the cross-section would be one over which the net effects of the other ingredients are stable. Differences in patent grants and R&D spending across the country’s states provides a good source of such cross-sectional variation. Such data are available for most states on an irregular basis from 1977 to 1998.
I use this approach in the following exercise: First, to account for differences in scale among states, I divide both patents and R&D for each state and each year by the number of workers in that state in that year. Second, I take the average of each of these variables (in logs) over 1977 to 1998. Finally, I regress average log patents per worker on average log R&D per worker over a panel of 37 states with data over this period. This is known as a “between” regression since it focuses on the variation between cross-sectional units rather than within them over time.
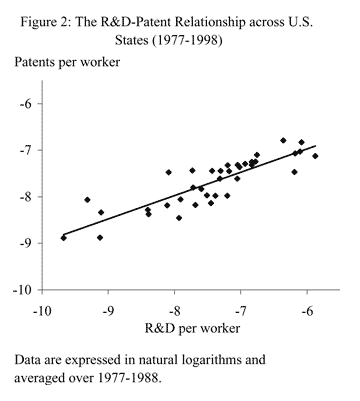
Figure 2 shows a scatterplot of the average log patents per worker plotted against the average log R&D per worker for 1977-1998. The line through the points represents the linear regression.
The figure suggests a very strong relationship between patents and R&D at the state level. Specifically, the regression results indicate that 74% of the cross-state differences in patents per worker can be explained by cross-state differences in R&D per worker. The state-level results are consistent with the results in Bound (1984), finding that R&D spending explains a great deal of the cross-sectional variation in patents using firm-level data. R&D does appear to be a very important determinant of patents.
Nevertheless, other factors that do not vary across states but that do vary over time also could be important and could have changed in ways that have contributed to the diverging trends in patents and R&D. The next section takes a look at those factors.
Have the legal or bureaucratic environments changed?
A potentially important factor affecting the trend in patents is the legal environment. Patents are only as valuable as their enforceability in the courts. Over the past half century, U.S. patent law changes have been relatively few and relatively minor—except for one major development in 1982. That year, the Ninth Federal Circuit Court of Appeals was established to handle all of the nation’s patent litigation appeals. Before then, patent appeals were handled by the Appeals Courts for the local Districts, which varied in terms of their toughness on enforcing patent infringement. At the time of its establishment, the Ninth Circuit was generally expected to be “pro-patent,” and indeed, to this day it continues to have a “pro-patent” reputation. Thus, if anything, this legal environment change would have increased the ratio of patents to R&D spending.
Another factor affecting patents is bureaucratic changes at the U.S. Patent and Trademark Office (PTO). Griliches (1990) showed that while the fraction of patent applications eventually granted remained roughly constant at 65% on average over the period 1947-1989, fluctuations in the PTO’s budget have had substantial effects on the average lag between application and grant. Increases in this lag can deter inventors from applying for patents since it reduces their value. However, over the period 1947-1989, Griliches finds no evidence of a positive trend in the average lag length. So it does not appear that the ratio of patents to R&D spending has been substantially affected by bureaucratic changes.
Has the propensity to patent changed?
Another potential explanation of the trend in declining patents per R&D expenditure is that the “propensity to patent” may be declining. That is, firms may be relying less and less on patents as a mechanism for appropriating returns from their R&D investments. This could occur because the nature of innovations is changing in such a way that patents are becoming less effective appropriation mechanisms. The available evidence on this hypothesis is limited but supportive. Based on results from two separate surveys of U.S. R&D labs conducted in 1983 and 1994, Cohen, Nelson, and Walsh (2000) report that patents appear to be considered less effective by lab managers as an appropriation mechanism in the later survey than in the earlier survey, suggesting that the propensity to patent may well be declining.
Has the quality of patents gone up?
A third possible factor behind the decline in patents per R&D dollar is that ideas, codified in patents, are increasing in quality, that is, in social value. Therefore, even though the extensive margin of innovation—patent counts—is growing slower than R&D spending, the intensive margin—quality per patent—could be growing faster than R&D spending; and the product of the two—total patent quality—could, in fact, be growing as fast or faster than R&D spending. Indeed, there is some evidence supporting this notion. In the economic literature on patents, the number of times a patent is cited by other patents often is used as an indicator of the social value of the patent, which, of course, is unobserved and can vary quite a bit from patent to patent. Hall, Jaffe, and Trajtenberg (2002) find that the average number of citations (of other U.S. patents) made by a patent increased around 3.3% a year from 1975-1999. Ideally, we would instead like to know the trend in the average number of citations received by a patent over this period. However, since citations are made many years into the future—the citation lag is typically around 15 years—we do not yet know how many citations will eventually be received by recent patents. Nonetheless, over long periods of time, the trend in citations made and citations received must be equal. Thus, if we weighted patents by the number of citations they receive, they may, in fact, be keeping up with or even outpacing real R&D spending.
It appears that the decline in patents per real R&D expenditure over the last half century may not be as distressing as it initially seems. The cross-state regression discussed above suggests that the number of patents is, on average, determined by R&D, lending credence to the notion that patent counts are useful indicators of technological change over extended periods of time. However, they are not perfect indicators. Simple patent counts miss some dimensions of technological change. And it appears that these other dimensions actually have increased in recent decades. First, there is tentative evidence that firms are increasingly moving away from patents as a means of appropriating returns from their R&D investments and toward other means, such as secrecy. Second, the number of citations received by the average patent has increased over the last couple of decades, suggesting that the social value of the average patent has increased. The possibility that more and more technological change is not being patented and that the “size” of the technological change codified in the average patent is increasing leaves open the possibility that the relationship between research input and true technology output has not changed over time.
Daniel Wilson
Economist
References
Bound, John. 1984. “Who Does R&D and Who Patents?” In NBER Conference Report, ed. Zvi Griliches, pp. 21-54. Chicago: University of Chicago Press.
Cohen, Wesley M., Richard R. Nelson, and John P. Walsh. 2000. “Protecting Their Intellectual Assets: Appropriability Conditions and Why U.S. Manufacturing Firms Patent (or Not).” NBER Working Paper 7552 (February).
Griliches, Zvi. 1990. “Patent Statistics as Economic Indicators: A Survey.” Journal of Economic Literature 28 (December) pp. 1661-1707.
Hall, Bronwyn H., Adam B. Jaffe, and Manuel Trajtenberg. 2002. “The NBER Patent-Citations Data File: Lessons, Insights, and Methodological Tools.” In Patents, Citations, and Innovation, eds. Adam Jaffe and Manuel Trajtenberg, pp. 403-459. Cambridge, MA: MIT Press.
Opinions expressed in FRBSF Economic Letter do not necessarily reflect the views of the management of the Federal Reserve Bank of San Francisco or of the Board of Governors of the Federal Reserve System. This publication is edited by Anita Todd and Karen Barnes. Permission to reprint portions of articles or whole articles must be obtained in writing. Please send editorial comments and requests for reprint permission to research.library@sf.frb.org