
Rising inequality in individual earnings has been an important feature of the economic landscape in the United States in recent decades. The increased dispersion in yearly earnings has caused some to worry that a more permanent widening of the distribution has occurred.
Rising inequality in individual earnings has been an important feature of the economic landscape in the United States in recent decades. The increased dispersion in yearly earnings has caused some to worry that a more permanent widening of the distribution has occurred. To determine whether this concern is justified, it is necessary to look beyond yearly differences in earnings and examine the paths of individuals’ earnings over time. Specifically, we must know the degree to which individuals are mobile—able to move freely up (or down) the earnings distribution. If individuals are able to climb up the earnings ladder, then changes in the dispersion of annual earnings are less informative. If individuals are not mobile, then yearly inequality may be a good proxy for lifetime inequality.
In this Economic Letter, we review trends in earnings inequality and mobility for the years 1967-2000. Accurate assessment of these patterns is important for crafting and evaluating national economic policies. A recent example is the impact of federal tax cuts, which Hubbard (2003) argued depends on individuals’ lifetime incomes and, hence, their earnings mobility.
To investigate the evolution of the distribution of individual earnings, we use data from the Panel Study of Income Dynamics (PSID), developed and administered by the Survey Research Center at the University of Michigan. The PSID began with a representative sample of about 3,000 U.S. families in 1968 (excluding the low-income supplemental sample). By following the individuals from these families over time as they formed and dissolved their own families, the PSID has remained largely representative of the U.S. population. The survey was administered yearly until 1997, and thereafter has been administered every other year.
We restrict our analysis to male household heads in their prime earnings years (age 25-59). This group has been the focus of much previous research on the distribution of earnings, due in large part to its high degree of labor force participation. We include men who worked approximately full time for the entire year (at least 1,750 hours), so that our analysis focuses directly on the trends in rewards to market work and is relatively unaffected by cyclical variation in job availability. Our measure of earnings is total labor earnings (paid and self-employment) in the year prior to the survey, adjusted for inflation using the GDP deflator for personal consumption expenditures and 1996 as the base year.
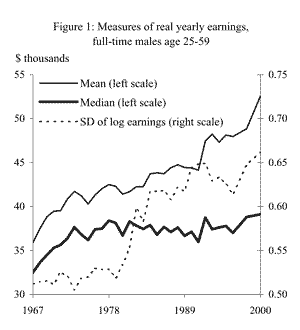 Figure 1 displays several key measures of the distribution of yearly earnings. We provide two measures of the midpoint of the earnings distribution: the mean is the simple average of earnings in the sample, and the median represents earnings of the individual for whom half the sample earns more and the other half earns less. The mean and median differ if there is a disproportionate number of high-wage or low-wage individuals.
The figure indicates that, for the most part, real median earnings have been flat since the mid-1970s. In 1996 dollars, median yearly earnings were $37,700 in 1973, dropped down to $35,900 in 1991, and were back up to $39,100 in 2000. By contrast, mean earnings have risen almost continuously since 1967. This pattern of flat median earnings and rising mean earnings suggests that earnings gains have been disproportionately concentrated among high earners.
This pattern of rising inequality also is reflected in the standard deviation of earnings (measured in natural logarithms and displayed as the dotted line), which indicates the extent of “typical” earnings dispersion measured in percentage terms. The standard deviation was largely unchanged between 1967 and 1979, increased substantially in the early 1980s and early 1990s, and then exhibited an up-and-down pattern later in the 1990s. The pattern in the standard deviation is similar to that found by Card and DiNardo (2002), using data from the Current Population Survey (CPS), the federal government’s official source for labor market information.
These measures of yearly earnings inequality suggest that the gaps between high-wage and low-wage workers increased between the late 1970s and early 1990s. However, this does not necessarily imply that the gaps in individuals’ lifetime earnings grew as well. Understanding whether this pattern persists at the individual level—that is, whether lifetime earnings gaps are widening—requires examining individual earnings changes over time.
A primary advantage of the PSID data is that they track individuals over time, which enables us to examine earnings histories for a specific set of individuals. This in turn enables us to address the question of earnings mobility, or the ability of individuals to move up (or down) the earnings distribution.
To avoid transitory fluctuations and keep the analysis focused on economically meaningful changes in long-term earnings and purchasing power, we use measures of earnings averaged over five-year periods. To compare the pattern of earnings changes in the 1970s, 1980s, and 1990s, we examine earnings changes that occurred for fixed samples of men between three pairs of five-year periods: 1967/71 to 1977/81, 1977/81 to 1987/91, and 1985/89 to 1994/2000 (the latest five-year period available, excluding the nonsampled years of 1997 and 1999). We focus on real (inflation-adjusted) earnings and apply essentially the same sample restrictions as those described above for the yearly earnings tabulations. However, for each comparison of earnings changes, the sample is restricted to men for whom we have valid earnings observations for all ten sample years underlying the comparison. Also, the sample is restricted to men aged 25-45 in the base period, so that they are no older than 59 in the later period being used for the comparison.
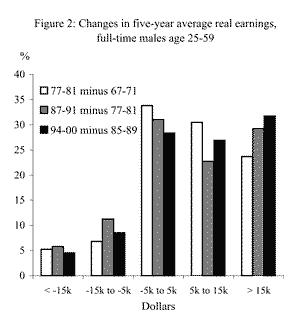 Figure 2 displays the shares of individuals whose changes in five-year average earnings in the 1970s, 1980s, and 1990s fall into different value groupings. For example, the first three bars show the percentage of individuals who experienced earnings losses greater than $15,000 in the 1970s, 1980s, and 1990s. All values are in real dollars. As the figure indicates, individuals were more likely to experience earnings gains than earnings losses in all three decades. This reflects, in part, the normal tendency for prime-age male earnings to increase as men age and grow into jobs with higher skill requirements and greater authority. That said, there are notable differences in the pattern of earnings gains over time. In the 1970s (that is, the change between 1967/71 and 1977/81), the most likely earnings path for a prime-age male involved little change in five-year average earnings during a decade. About 34% of men in our sample had five-year average earnings in 1977/81 within $5,000 (up or down) of their 1967/71 earnings. Another 30% saw their earnings rise between $5,000 and $15,000 over the period. Large earnings gains (more than $15,000) were less frequent, occurring for about 24% of all men in our sample. The frequency of large earnings gains (more than $15,000) rose in the 1980s and again in the 1990s; by the 1990s 31% of men experienced earnings gains of $15,000 or more.
The picture for earnings losses is more mixed. The likelihood of an earnings decline of more than $5,000 rose in the 1980s. Between 1967/71 and 1977/81, 11% of the men in our sample experienced earnings losses greater than $5,000; during the 1980s period, 17% experienced such a decline. This pattern reversed somewhat during the 1990s, with fewer men recording losses of $15,000 or more. The percentage of men with earnings losses between $5,000 and $15,000 also came down in the 1990s but remained higher than it was during the 1970s.
While the tabulations underlying Figure 2 tell us that more people gain than lose, they do not reveal who is experiencing the earnings gains or losses. Thus, they do not answer the question of whether earnings gains are most pronounced among individuals who are higher earners or those who are lower earners in the first place. This relationship between the initial level of earnings (for example, in 1967/71) and the change in earnings (for example, between 1967/71 and 1977/81) can be captured by examining correlations. 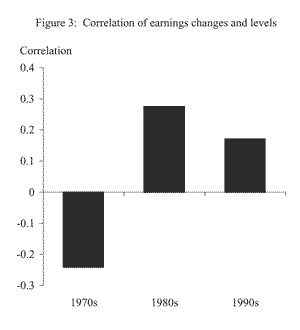 Figure 3 displays these correlations, which represent the tendency for average earnings to increase or decrease in accordance with the initial level of average earnings in the base period.
The first thing to note from this analysis is that the correlations between initial earnings and the change in earnings is relatively low in all years. This suggests that the connection between initial earnings and earnings changes is relatively weak over our sample period. Even so, there are clear differences in these correlations over time. During the 1970s the correlation was negative, indicating that individuals with relatively low base period earnings tended to receive larger earnings gains than individuals with relatively high base period earnings. This pattern was reversed in the 1980s and 1990s: in those decades, base period earnings and earnings changes are positively related, indicating that individuals with higher base earnings tended to see larger increases in earnings. The positive correlation was weaker in the 1990s than in the 1980s, indicating that low earners’ relative ability to improve their earnings increased somewhat between these two decades. However, in the 1990s it remained true that individuals with higher initial earnings tended to experience larger earnings gains.
Like official government data sources, the PSID data for prime-age, full-time male earners show relatively flat median earnings and rising dispersion across high earners and low earners between the late 1970s and early 1990s. The PSID data also indicate a substantial amount of upward mobility over 10-year horizons during the period. There is a moderate amount of downward mobility as well, even though prime-age men typically see their earnings grow as they age.
Overall, these results indicate that upward mobility remains an attainable goal for the majority of working age individuals. The presence of mobility implies that yearly measures of earnings inequality likely overstate the permanent earnings differences between individuals. That said, the earnings dynamic has changed in recent decades, shifting from one that slightly benefits lower earners to one that slightly benefits higher earners.
Mary Daly
Research Advisor
Rob Valletta
Research Advisor
References
Card, David, and John DiNardo. 2002. “Skill-Biased Technological Change and Rising Wage Inequality: Some Problems and Puzzles.” Journal of Labor Economics 20(4), pp. 733-783.
Hubbard, Glenn. 2003. “Measure Tax-Cut ‘Fairness’ Over a Lifetime.” Wall Street Journal, January 8.
Opinions expressed in FRBSF Economic Letter do not necessarily reflect the views of the management of the Federal Reserve Bank of San Francisco or of the Board of Governors of the Federal Reserve System. This publication is edited by Anita Todd and Karen Barnes. Permission to reprint portions of articles or whole articles must be obtained in writing. Please send editorial comments and requests for reprint permission to research.library@sf.frb.org