There are enormous differences among countries in terms of what kinds of capital equipment they use. These differences are reflected in patterns of imports for the most part, since, except for a few highly advanced, equipment-producing countries, most countries import the vast majority of their equipment.
- The variation in the composition of capital equipment imports
- Why does capital composition differ so much across countries?
- Are differences in capital composition related to differences in per capita income?
- Why are some capital types more positively related to income than others?
- Conclusion
- References
|
There are enormous differences among countries in terms of what kinds of capital equipment they use. These differences are reflected in patterns of imports for the most part, since, except for a few highly advanced, equipment-producing countries, most countries import the vast majority of their equipment. To see how extreme the differences between countries’ capital composition can be, consider the example of Ireland and Equatorial Guinea. In 1997, over one-third of the equipment Ireland imported was in the high-tech category “Office, Computing, and Accounting Machinery” (OCAM), while only 3% was in “Fabricated Metal Products” (cutlery, hand tools, general hardware, etc.). In the same year, over one-third of the equipment imported by the western African nation of Equatorial Guinea was fabricated metal products and only 1% was in the OCAM category.
This Economic Letter explores three questions that arise in light of such striking differences in the composition of capital equipment among countries: (1) Why do these differences exist? (2) Are the differences in capital composition correlated with differences in per capita income between countries like Equatorial Guinea and Ireland? (3) If so, why do certain types of capital have stronger positive correlations with income per capita than other types of capital?
The variation in the composition of capital equipment imports
For any type of equipment, one can point to pairs of countries with wildly different import shares, such as those of Ireland and Equatorial Guinea in relation to imports of OCAM and Fabricated Metal Products. In fact, analyzing imports data on 165 countries, Caselli and Wilson (2004) find that, for any type of equipment one looks at, there is tremendous variation across countries in how much that type contributes to total equipment imports (even after excluding outliers like Ireland and Equatorial Guinea).
Caselli and Wilson and others, have shown that the composition of equipment imports closely matches the composition of equipment investment (imports minus exports plus domestic production), especially for smaller economies. Examining the mix of equipment imports among countries then gives a good picture of the differences in the composition of equipment used in the production processes of these countries. In particular, the sizable variation across countries in the composition of equipment imports tells us that there is sizable variation in the composition of equipment use, which, unlike imports, is unobserved for a large number of countries.
Why does capital composition differ so much across countries?
It makes sense to think that businesses and governments around the world decide on the kinds of capital to use (and in what proportions to use them) by weighing the costs and benefits of various possible combinations of equipment types. Clearly, the costs and benefits associated with a particular composition of capital vary from country to country and from business to business within a country. For example, Equatorial Guinea presumably uses proportionately far fewer computers than Ireland by intention. Part of the reason could be that it costs much more to ship computers to businesses in Equatorial Guinea because the country’s transportation infrastructure is less well developed—in fact, Equatorial Guinea has no paved roads. But this reason doesn’t hold up, because such costs also would affect other types of equipment, such as Fabricated Metal Products, which Equatorial Guinea does import. So we can conclude that, on average, computers provide a lower net benefit, relative to other types of equipment, in Equatorial Guinea than they do in Ireland.
In Caselli and Wilson (2004), the authors construct a formal model of capital composition, and find that the share of any particular type of capital in a country’s total capital stock is determined by two factors. The first factor is the capital type’s productivity in that country relative to the productivity of all other types in that country; for example, in a country like Equatorial Guinea, which is dominated by agriculture and has a very small professional services sector, computers will have fewer productive uses than farm machinery. The second factor is the degree of technical substitutability between different capital goods; for example, since farm machinery and computers are not perfect substitutes (a computer cannot plow a field) some of both are needed. Of these two factors, though, only the first can explain the differences in capital composition across countries. That is because only the first factor varies by countries. The second factor—the degree of technical substitutability between different capital goods—is a universal characteristic of those capital goods; in other words, no matter what country we consider, computers still can’t plow fields. Therefore, the cross-country variation in a type of capital’s share of total capital is entirely a result of cross-country variation in the productivity of that type of capital relative to other types.
For instance, in the case of Ireland and Equatorial Guinea, the Caselli-Wilson model would suggest that Ireland has a higher share of computers and a lower share of fabricated metal products than Equatorial Guinea because in Ireland computers are more productive than fabricated metal products. In other words, Ireland has a comparative advantage in using computers, and Equatorial Guinea has a comparative advantage in using fabricated metal products. This is true, even if the absolute productivity of using both types of capital is higher in Ireland than in Equatorial Guinea.
What are the sources of such comparative advantages? Caselli and Wilson identify various country-specific factors, such as the education level of the workforce, the kinds of products that the country specializes in, the enforcement of intellectual property rights, and the financial and overall levels of development in the country. The authors demonstrate that these specific factors do in fact explain part of the variation in capital composition across countries; at the same time, the majority of the variation is left unexplained, suggesting that many important factors remain to be identified.
Are differences in capital composition related to differences in per capita income?
Per capita income, like capital composition, differs enormously across nations. For example, according to one measure used by the World Bank, in 2001, per capita income in the U.S. was 65 times that of Tanzania. The question then arises: Is capital composition correlated with per capita income? The answer is yes. Caselli and Wilson examined data on several broad types of capital for 118 countries in 1995; for each country, they calculated the correlation between its per capita income and each capital type’s share of total capital (as reflected by imports). Figure 1 presents a summary of the results. Computers and related equipment have the highest correlation with per capita income; professional goods, electrical equipment, communications equipment, and aircraft also are positively correlated. In contrast, non-electrical equipment, fabricated metal products, motor vehicles, and other transportation equipment are negatively related to income. These correlations between capital composition and per capita income, together with the fact that differences in capital composition are at least as large as the differences in per capita income, lead to the conclusion that capital composition has the potential to explain a large part of the variation in per capita income.
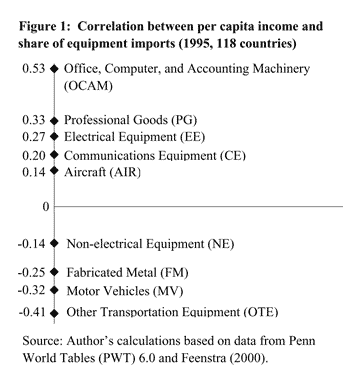
An important caveat, however, is that we cannot say whether there is a causal link between capital composition and income. The positive correlations may simply reflect the fact that both capital composition and per capita income are driven by the same underlying factors, such as the educational level of the workforce. Even using multivariate regression techniques to control for the effect on income of education, infrastructure, and other factors that are correlated with both income and capital composition may not solve the problem, as there are likely to be still other such factors that are unobserved. Thus, establishing whether there is a causal link from capital composition to per capita income remains an important area for future research.
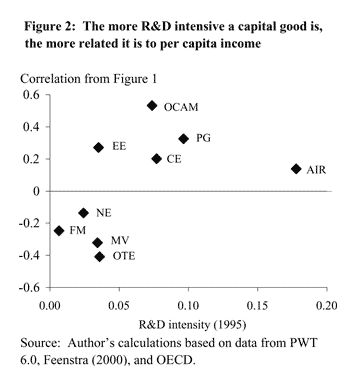
Why are some capital types more positively related to income than others?
The answer seems to be that some capital types embody more technology than others. Figure 2 plots the correlation results from Figure 1 against a measure of the global research and development (R&D) “intensity” for each capital type; the R&D intensity is defined as the worldwide sum of R&D spending on that capital type divided by the worldwide sales of that capital type. (Note that the measure of R&D intensity is based on data from R&D and sales only for OECD countries; however, as other studies have shown, the vast majority of the R&D and production of capital goods is done in a small number of advanced OECD countries.) The R&D intensity of a capital type can be thought of as a proxy for the level of technology embodied in it.
Clearly, capital types that embody more advanced technology tend to have a more positive relationship with income per capita. For example, of our nine broad equipment categories, Professional Goods (e.g., scientific instruments) ranked second in the amount of worldwide R&D devoted to the category relative to sales. It also had the second highest correlation with income per capita. These results should not be too surprising. In fact, it is perfectly consistent with the notion that there are spillovers from “producers” of innovation (in this case, advanced, R&D-performing countries) to the users of innovations (less advanced, importing countries). Wilson (2002) showed that the same phenomenon occurs at the industry level within the U.S.; that is, industries that invest (import) proportionately more in R&D-intensive capital goods tend to have higher productivity (income per worker).
The potential causal link from the composition of capital equipment to income in a country raises some tantalizing possibilities. If there is a causal link, the empirical findings discussed in this Economic Letter suggest that the capital technology generated by the research efforts of advanced countries and the higher levels of productivity this technology enables may spill over to countries in the rest of the world through their capital imports. Moreover, countries appear to choose the composition of their capital and, hence, the level of technology embodied in their capital, based on country-specific factors that may, in turn, determine the productivity of different technologies in that country. Thus, country-specific factors like human capital, infrastructure, legal institutions, financial development, and so forth, which likely have direct effects on income per capita, also may have an indirect effect by encouraging investment in those types of capital goods that embody the most technology. For example, increasing educational levels in a nation may increase national productivity not only because workers are more able to perform complex tasks (regardless of the equipment they have to use), but also because the presence of educated workers raises the benefits of importing high-tech equipment which enables higher productivity.
Daniel Wilson
Economist
References
[URLs accessed March 2004.]
Caselli, Francesco, and Daniel J. Wilson. 2004. “Importing Technology.” Journal of Monetary Economics 51 (January), pp. 1-32.
Feenstra, Robert C. 2000. “World Trade Flows, 1980-1997.” Mimeo.
Wilson, Daniel J. 2002. “Is Embodied Technological Change the Result of Upstream R&D? Industry-Level Evidence.” Review of Economic Dynamics 5(2) (April), pp. 342-362.
http://ideas.repec.org/a/red/issued/v5y2002i2p285-317.html
Opinions expressed in FRBSF Economic Letter do not necessarily reflect the views of the management of the Federal Reserve Bank of San Francisco or of the Board of Governors of the Federal Reserve System. This publication is edited by Anita Todd and Karen Barnes. Permission to reprint portions of articles or whole articles must be obtained in writing. Please send editorial comments and requests for reprint permission to research.library@sf.frb.org