Conditions in labor markets are largely reflected in the number of jobs employers want to fill (job vacancies) and the number of people seeking jobs (the unemployed). Over the business cycle, for example, job vacancy rates and unemployment rates generally exhibit negative co-movement, with high vacancies and low unemployment when the economy is growing and vice versa when the economy is contracting.
Conditions in labor markets are largely reflected in the number of jobs employers want to fill (job vacancies) and the number of people seeking jobs (the unemployed). Over the business cycle, for example, job vacancy rates and unemployment rates generally exhibit negative co-movement, with high vacancies and low unemployment when the economy is growing and vice versa when the economy is contracting. Beyond that short-run relationship, however, positive co-movement of the vacancy and unemployment series over longer time periods reflects changes in the speed and effectiveness of job matching between employers and job seekers. When the job-matching process is slow, perhaps due to changes in the amount of necessary job reallocation across geographic regions or industries, both unemployment and vacancies can coexist at high levels, representing underutilized labor resources.
This Economic Letter examines the evidence on long-term shifts in the speed and efficiency of job matching in U.S. labor markets by using the so-called Beveridge curve. The Beveridge curve is an empirical measure of the relationship between the job vacancy rate and the unemployment rate. Changes in the job-matching process suggested by movements in the Beveridge curve, and their implications for U.S. labor market performance, have not been extensively analyzed, due in part to the absence of consistent data on job vacancies over a long time period. In this Economic Letter, we utilize new data from the U.S. Bureau of Labor Statistics (BLS) to construct a long-term vacancy series and corresponding estimates of the Beveridge curve. We find that declining dispersion of economic growth across geographic regions helps explain improvements in the job-matching process since the mid-1980s and reinforces existing depictions of improved performance of the U.S. aggregate labor market in the 1990s (for example, Katz and Krueger 1999).
Forming the empirical Beveridge curve
Empirical representation of the Beveridge curve requires choosing measures of the job vacancy rate and the unemployment rate. Because there is no continuous aggregate job vacancy series covering a sufficiently long period in the United States, the literature on the U.S. Beveridge curve has largely relied on the help-wanted advertising index to measure changes in job vacancies over time. The help-wanted index is compiled by The Conference Board, based on counts of help-wanted advertisements appearing in the classified section of a major newspaper in each of 51 cities nationwide; the data by city are aggregated to provide help-wanted index series for the nine major census divisions and the U.S. as a whole (see Abraham 1987 for more details). After normalizing by employment or labor force size, changes over time in the help-wanted index are interpreted as reflecting corresponding changes in the overall rate of job vacancies.
Abraham (1987) argued that the volume of help-wanted advertising has been affected by long-term changes in the occupational composition of employment (towards white-collar jobs that are more likely to be advertised), increased job advertising linked to equal employment opportunity pressures, and consolidation in newspaper markets, each of which arguably contributed to an upward drift in the help-wanted index during the 1960s and 1970s. In more recent work, however, Zagorsky (1998) extended the help-wanted series back to 1923 and applied updated correction factors to account for the influences identified by Abraham; he found little evidence of long-term trends in the vacancy series (relative to labor market conditions) over the period 1923-1994. On the other hand, a strong downward trend in the help-wanted series is evident since the early to mid-1990s. This downward trend appears to be due to growing reliance on alternative sources of job search, such as the Internet, which have substantially reduced employers’ reliance on traditional help-wanted advertising.
Fortunately, relatively new data are available to serve the dual purpose of pinning down the recent trend in help-wanted advertising and also translating the help-wanted series into a job vacancy series: the monthly “Job Openings and Labor Turnover Survey” (JOLTS) conducted by the U.S. BLS beginning in December 2000. The JOLTS survey is administered to a representative sample of about 16,000 establishments nationwide and provides data on job openings as well as hires and separations. In addition to the national series, the data are available for the four broad census regions. The job opening (vacancy) rate is defined as the ratio of the number of job openings to the sum of employment and job openings (JOLTS survey information is available online).
The JOLTS series only became available in December 2000, near the peak of the last expansion, which limits its direct use for analysis of the Beveridge curve. However, it is straightforward to use the JOLTS data to translate the help-wanted index into a long-term vacancy series, using standard regression techniques. In doing so, we accounted for the downward trend in the help-wanted index since the early 1990s. Examination of the data and sensitivity tests revealed that accounting for a downward trend beginning in 1993 produced the most plausible range of values for the fitted vacancy rate series at the national and regional level (see Valletta 2005 for more details).
Like the vacancy rate measured by the help-wanted index, the U.S. unemployment rate also has undergone long-term changes in recent decades (Valletta and Hodges 2005). The most important long-term influence has been the aging of the U.S. population; due to the lower unemployment rates experienced by older age groups, population aging has reduced the average unemployment rate since the late 1970s. We account for this factor and its influence on the Beveridge curve by using an “age-adjusted” unemployment rate, which represents what the unemployment rate would be if the labor force shares of seven age groups had not changed since a particular “base year.” We use a base year of 1978; as noted by Shimer (1999), the age structure of the U.S. labor force in 1978 was the most conducive to high unemployment rates of any year during the post-war period.
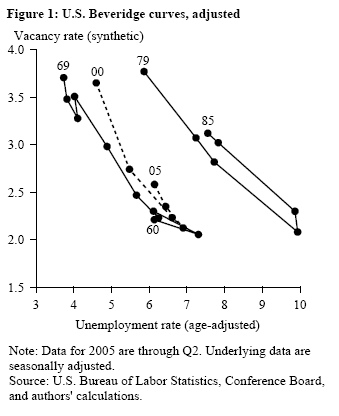 Figure 1 displays the U.S. Beveridge curve based on the fitted vacancy rate series and age-adjusted unemployment rate series for selected periods between 1960 and 2005. The Beveridge curves in this figure exhibit a typical counterclockwise adjustment pattern around recessions (1960-61, 1981-82, and 2001), as vacancies rise more quickly than unemployment falls during the recovery phase. The outward shift in the Beveridge curve between the periods 1960-69 and 1979-85, as identified by Abraham (1987), is clearly evident, as is a substantial inward shift between 1979-85 and 2000-05. This pattern suggests that the speed and effectiveness of the job-matching process deteriorated in the 1970s through the early 1980s and then improved.
One leading explanation for these movements in the Beveridge curve is changes in the dispersion of employment growth across regions. If labor demand is growing in some parts of the country and shrinking in others, a “regional mismatch” can occur, whereby large numbers of unemployed individuals must move across geographic regions in order to be matched with available jobs. The need for such costly and time-consuming geographic reallocation slows down the job-matching process and increases the likelihood that unemployment and vacancies will both exist at high levels. Indeed, Abraham found that rising regional mismatch accounted for a large share of the outward shift in the Beveridge curve between the 1960s and early 1980s (as depicted in Figure 1).
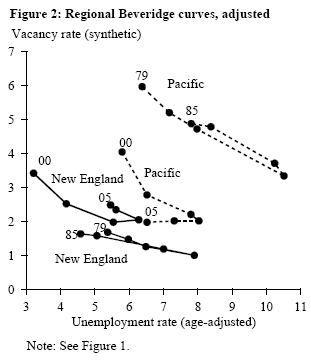
As a graphical illustration of changes in the degree of regional mismatch, Figure 2 displays Beveridge curves for two of the nine census divisions: New England and the Pacific. Their Beveridge curves were far apart during the years 1979-85, reflecting substantial geographic mismatch in the strength of labor demand. Since then, the regional curves have largely converged, indicating a decline in mismatch. While we only display two regions in Figure 2, this pattern of convergence in labor demand and supply conditions is evident across U.S. regions and states more generally.
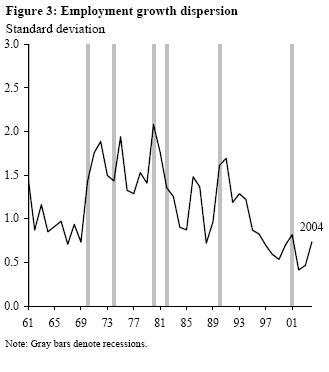
Figure 3 shows the overall degree to which patterns of growth in labor demand have converged across regions; it displays the dispersion (standard deviation) of yearly employment growth across census divisions. This series plays a key role in explaining the outward and inward movements of the U.S. Beveridge curve in recent decades. The dispersion of employment growth increased substantially between the late 1960s through about 1980, when the Beveridge curve shifted out, and then declined by an even greater amount since the early 1980s, when the Beveridge curve shifted back in.
On net, the magnitude of the Beveridge curve shifts and changes in regional growth dispersion are quite consistent over the period 1970-2005. Abraham (1987) found that about 1.4 percentage points of the 1.8 percentage point increase in the unemployment rate associated with Beveridge curve shifts between 1970 and 1985 was due to rising geographic dispersion of employment growth. By contrast, we find that geographic growth dispersion fell below its 1960s levels by the early 2000s, reversing the pattern identified by Abraham. The result was a 1.5 to 2 percentage point decline in the unemployment rate associated with Beveridge curve shifts between the mid-1980s and early 2000s, producing a Beveridge curve that is interior to any observed since the 1960s.
The adjusted vacancy and unemployment data that we use indicate that a pronounced inward shift in the position of the Beveridge curve has been evident since the mid-1980s, reversing the earlier pattern identified by Abraham (1987) and implying reduced job reallocation or increased efficiency for the job-matching process in the United States. Our analyses of regional Beveridge curves and the dispersion of labor demand across regions suggest that a decline in necessary job reallocation was responsible for this shift. In particular, the process identified by Abraham (1987), whereby increasing dispersion of labor demand growth across geographic areas caused the Beveridge curve to shift out, has been reversed, causing the Beveridge curve to shift back in.
More generally, our finding of inward shifts in the Beveridge curve over the past two decades reinforce Katz and Krueger’s (1999) conclusions regarding improved U.S. labor market performance in the 1990s. The inward shift in the Beveridge curve may underlie the more favorable tradeoff between unemployment and wages that has been estimated for the 1990s. Moreover, we find that these favorable trends continued into 2005. These findings suggest that the Beveridge curve may merit renewed attention by researchers.
Rob Valletta
Research Advisor
Jaclyn Hodges
Research Associate
Abraham, Katharine G. 1987. “Help-Wanted Advertising, Job Vacancies, and Unemployment.” Brookings Papers on Economic Activity 1, pp. 207-248.
Katz, Lawrence F., and Alan Krueger. 1999. “The High-Pressure U.S. Labor Market of the 1990s.” Brookings Papers on Economic Activity 1, pp. 1-65.
Shimer, Robert. 1999. “Why Is the U.S. Unemployment Rate So Much Lower?” In NBER Macroeconomics Annual 1998, eds. Ben S. Bernanke and Julio J. Rotemberg. Cambridge, MA: MIT Press, pp. 11-61.
Valletta, Robert G. 2005. “Why Has the U.S. Beveridge Curve Shifted Back? New Evidence Using Regional Data.” FRBSF Working Paper 2005-25 (December).
Valletta, Robert G., and Jaclyn Hodges. 2005. “Age and Education Effects on the Unemployment Rate.” FRBSF Economic Letter 2005-15 (July 15).
Zagorsky, Jay L. 1998. “Job Vacancies in the United States, 1923 to 1994.” Review of Economics and Statistics 80(2), pp. 338-345.
Opinions expressed in FRBSF Economic Letter do not necessarily reflect the views of the management of the Federal Reserve Bank of San Francisco or of the Board of Governors of the Federal Reserve System. This publication is edited by Anita Todd and Karen Barnes. Permission to reprint portions of articles or whole articles must be obtained in writing. Please send editorial comments and requests for reprint permission to research.library@sf.frb.org