With households’ property debt surging, the use of adjustable-rate mortgages increasing, and interest rates rising, some observers have raised concerns about households’ ability to service that debt. To gain a better idea of the distribution of property debt burdens and how it has changed over time, this Economic Letter presents data from the Survey of Consumer Finances (SCF), which contains information on different types of property debt, debt service, and income.
- Defining property debt, debt service, and debt burden
- Basic facts for households with some property debt
- Adjustable-rate mortgages
- Conclusion
- References
With households’ property debt surging, the use of adjustable-rate mortgages increasing, and interest rates rising, some observers have raised concerns about households’ ability to service that debt. To gain a better idea of the distribution of property debt burdens and how it has changed over time, this Economic Letter presents data from the Survey of Consumer Finances (SCF), which contains information on different types of property debt, debt service, and income. The SCF data show that property debt burdens in 2004 were only slightly higher than they were in the mid-1990s. Also, although the use of adjustable-rate mortgages has increased, many households that have some of their property debt in these instruments have fairly low debt burdens, suggesting that they could successfully adapt if their mortgage payments were to increase.
Defining property debt, debt service, and debt burden
We begin with some definitions. “Property debt” is any debt backed by any of the household’s residential real estate (mortgages, home equity loans, and land contracts). According to the Flow of Funds data from the Federal Reserve, mortgages alone make up nearly 90% of the total debt held by U.S. households.
Although studying the level of debt is important, we are more interested in the amount a household’s creditors expect each year in repayment (for instance, the “minimum payment” on a bill), a concept known as “debt service.” The amount of debt service per year depends on a number of factors, including the interest rates charged on the loans (higher interest rates lead to higher required payments).
Finally, the impact of the debt depends on a household’s income; all else equal, the higher its income, the easier it is to pay a given level of debt service. To facilitate comparisons among households, we compute a measure called “debt burden,” which is the household’s annual debt service divided by annual pre-tax income. For example, a household with a debt burden over 0.5 has to spend more than half its income servicing debts and might be described as heavily “stressed” or “leveraged,” while one with a debt burden of 0.01 spends only 1% of its income on debts and should have less difficulty in making debt service payments.
Unfortunately, obtaining reliable data on debt burdens (that is, data that contain information on a household’s income and on a thorough portrayal of debt and debt service) is difficult. One of the few consistent data sources over time has been a survey conducted by the Federal Reserve Board called the Survey of Consumer Finances (SCF), which is conducted every three years. The most recent SCF data, for 2004, were released earlier this year and are summarized in Bucks, Kennickell, and Moore (2006).
Basic facts for households with some property debt
In recent years, the percent of households with some property debt has increased, in part reflecting an increase in the share of households that are homeowners. Based on the SCF, the share of households with property debt was 49% in 2004, compared to 41% in 1989 (these numbers are lower than the homeownership rate because some homeowners have no property debt).


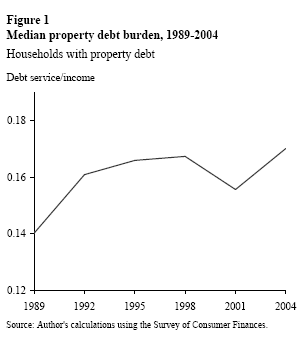
To provide some sense of how debt burdens have varied over time for households with at least some property debt, Figure 1 shows the median property debt burden from 1989 to 2004. This measure, also called the 50th percentile, tells us the debt burden for the household in the middle of the distribution; half the households have higher debt burdens than this, and half have lower debt burdens. We use it here in preference to the mean, or average, because it is less sensitive to the extremes and therefore provides a better picture of the typical household’s property debt burden.
Debt burdens have increased modestly, on net, from 1989 through 2004. The median property debt burden was 0.14 in 1989, and rose to 0.16 in 1992; it then increased slowly over the next decade (aside from a blip in 2001), moving up to 0.17 in 2004. While this is the highest level shown in Figure 1, it is less than a percentage point higher than the level reached in 1995.
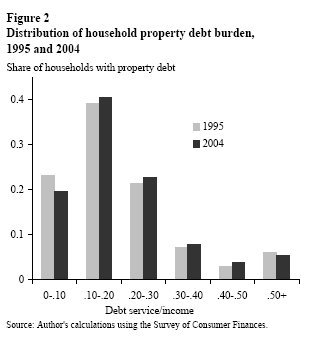
To provide more insight into debt burdens than we can get from examining the median, Figure 2 shows the distribution of property debt burdens for two years, 1995 and 2004. Notably, the distribution has shifted slightly towards higher debt burdens over this period. However, this shift is small enough that the 1995 and 2004 distributions remain similar. As in every year since 1989 a majority of households that had property debt in 2004 devoted less than 20% of their incomes to servicing that debt.
Ideally, one would like to be able to focus on those households most at risk of default. However, the SCF data do not allow us to track the same households over time to examine how transitory or permanent their debt burdens are. What we do know from the data is that the share of households with high debt burdens is similar now to what it has been in past years. In 2004 about 5.5% of households with property debt had debt burdens over 0.50, roughly similar to the fraction in earlier survey years.
A key area of household property debt that has raised concern is the use of adjustable-rate mortgages. With an adjustable-rate mortgage, a household may have a modest debt burden today that becomes quite onerous as the interest rate on the mortgage moves up. According to the 2004 SCF, 33% of households that have property debt have at least a portion in an adjustable-rate loan (we assume home equity loans have adjustable interest rates, while land contracts do not). This is an increase from 23% in 2001 and 25% in 1998. Although some households hold a small fraction of their total property debt in adjustable-rate instruments, more than one-half of households with adjustable-rate property loans in 2004 had all of their property debt in these instruments.
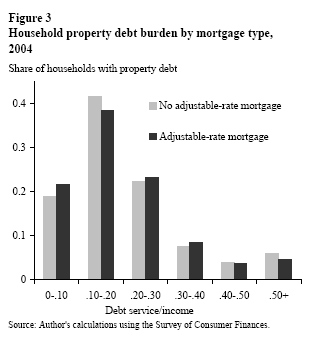
 Figure 3 shows the 2004 distribution of households’ home debt burdens by whether or not they have an adjustable-rate property loan. It seems that holders of adjustable-rate loans fit almost exactly the same pattern as other households. They are more likely to have debt burdens in the range of 0.2 to 0.4, but all the differences are small. These statistics suggest that most households that use adjustable-rate loans are not using the lower interest rates to fund insupportably large debts.
Although the distribution of debt burdens in 2004 appears roughly similar to what it was a decade ago, there is great uncertainty over how the future distribution of debt burdens will look. As adjustable-rate mortgage payments increase, some households may have difficulty servicing the higher debt. At the same time, many may be able to respond to these higher debt burdens in a number of ways, including refinancing and reducing the level of property debt.
It is difficult to say much about households’ ability to manage growing debt burdens from adjustable-rate mortgages in the future relying mainly on the data from the SCF. The SCF does not contain information after 2004, so we lack data on how things stand under current interest rates. Other data sources tell us that in 2005 the use of adjustable-rate mortgages increased and, according to the Flow of Funds data, households increased their mortgage debt by another 14.1% in 2005. We do not yet know how these changes have affected the distribution of debt burdens.
The SCF data show that property debt burdens in 2004 were only slightly higher than they were in the mid-1990s. Also, although the use of adjustable-rate mortgages has increased, many households that have some of their property debt in adjustable-rate mortgages have fairly low debt burdens, and may be able to adapt successfully to higher interest rates. However, there may still be some households that face financial distress as their mortgage payments increase.
Mark Doms
Senior Economist
Meryl Motika
Research Associate
[URLs accessed July 2006.]
Board of Governors of the Federal Reserve System. 2006. “Flow of Funds Accounts of the United States: Flows and Outstandings, Fourth Quarter 2005.”
Bucks, B., A. Kennickell, and K. Moore. 2006. “Recent Changes in U.S. Family Finances: Evidence from the 2001 and 2004 Survey of Consumer Finances.” Federal Reserve Bulletin 92, pp. A1-A38.
Opinions expressed in FRBSF Economic Letter do not necessarily reflect the views of the management of the Federal Reserve Bank of San Francisco or of the Board of Governors of the Federal Reserve System. This publication is edited by Anita Todd and Karen Barnes. Permission to reprint portions of articles or whole articles must be obtained in writing. Please send editorial comments and requests for reprint permission to research.library@sf.frb.org