Unemployment insurance benefits have been on an upward trend over the past two decades, partially reversing an earlier decline. The trend is associated with shifts toward a higher share of job losers among the unemployed and longer durations of unemployment, which may cause benefits to lapse for some recipients as labor market weakness persists.
The number of ongoing claims for unemployment insurance (UI) benefits recently reached a historic high in the United States. Given the severity of the current economic downturn, a high level of claims is to be expected, reflecting the UI system’s primary goal of providing temporary income support to workers who are involuntarily unemployed. The degree to which the UI system meets this goal depends in part on the extent to which eligible workers actually receive UI benefits. Researchers have documented a decline in UI receipt among eligible workers during the 1970s and 1980s, which partially offset the program’s role as a source of income support during economic downturns. In this Economic Letter, we update past work on trends in UI receipt. Our analyses identify an upward trend in UI receipt over the past two decades as the composition of the unemployment pool has shifted toward permanent job losers, which has partially reversed the earlier decline. However, this effect may have been offset by the lengthening of unemployment spells that occurred during the same period. This is likely to cause UI benefits to lapse for some recipients as the current downturn continues.
Program history
The U.S. Unemployment Compensation Program, commonly referred to as UI, was created in 1935 by the Social Security Act. The program is jointly financed through federal and state employer payroll taxes. The tax rate for each employer depends on the past frequency of UI claims filed by its former employees (“experience rating”). By providing temporary partial wage replacement to workers who are involuntarily unemployed, UI benefits help sustain purchasing power during cyclical downturns, thereby functioning as an automatic stabilizer for the economy. Almost all regular state programs provide a maximum of 26 weeks of benefits. In addition, UI’s role as an automatic stabilizer in the face of severe economic downturns is reinforced by the availability of an additional 13 weeks of extended benefits for UI recipients in states where the unemployment rate exceeds a state-set trigger level. Additional federal extensions are periodically enacted during times of high unemployment when benefits are exhausted at a high rate. Such extensions were approved twice in 2008 and again in February 2009.
The program was originally made available to employees of private businesses employing eight or more workers. Coverage has expanded greatly since the 1950s. In 2006, 96.4% of civilian wage and salary workers were covered by the unemployment insurance system (U.S. House of Representatives 2008). In addition to the requirements that workers not be unemployed through their own choice and, in most states, that they be available for full-time work, eligible claimants must have met a base earnings requirement in their prior jobs over a preceding four-quarter period. These vary widely by state, ranging from $130 in Hawaii to $4,291 in North Carolina in 2008 (U.S. House of Representatives 2008). The amount and duration of weekly benefits also vary by state and are generally limited to a fixed fraction of the claimant’s prior wage, up to a maximum level. The average weekly benefit in 2007 was $288, replacing slightly over a third of the average weekly wage in the United States.
Recipiency trends
Figure 1
UI recipiency rate

Note: Ratio of continued claims to total unemployment. Gray bars indicate NBER recessions.
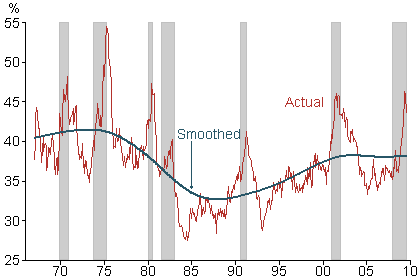
UI usage is subject to wide cyclical fluctuations, generally rising during recessions and falling during recoveries, consistent with the system’s role as an automatic stabilizer. However, UI usage also exhibits long-term, secular trends. These patterns can be seen in Figure 1, which displays a consistent measure of UI usage that is available back to 1967: the UI recipiency rate, which is calculated by dividing the weekly number of claims filed by the total number of unemployed as counted in the monthly labor force survey (the Current Population Survey, or CPS) conducted by the Bureau of Labor Statistics. In addition to the actual value of the rate, the figure shows a smoothed trend line generated using a statistical procedure that extracts the long-term trend and excludes short-term, cyclical fluctuations. The smoothed level was relatively constant from the late 1960s until the late 1970s, when it fell sharply, despite the extensive job losses that occurred during the recession of 1981-1982.
This secular decline in UI claims during the early 1980s is closely related to the decline in the take-up rate, defined as the percentage of UI-eligible individuals who claim and receive UI payments. Blank and Card (1991) found that most of the take-up rate decline was attributable to falling unionization and unemployment shifts toward states with lower UI take-up rates. Lower rates of unionization affect UI take-up because unions provide resources that ease filing procedures for members. The variation in take-up rates across states is less easily explained, but probably reflects cross-state differences in cultural norms regarding participation in public programs. The analysis of Anderson and Meyer (1997) indicates that the further decline in UI recipiency that is not explained by union and state effects is largely attributable to increasing taxation of UI benefits between 1979 and 1987, which reduced the net after-tax value of benefits and thereby decreased filing incentives.
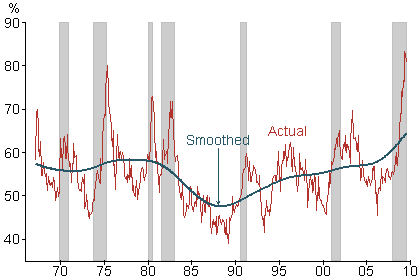
Figure 1 also shows that, since reaching a low in the early to mid-1980s, the UI recipiency rate increased modestly through about 2003, partially reversing the prior downward trend. The recent upward trend in UI recipiency is even more pronounced and consistent in Figure 2, which depicts the monthly ratio of new UI claims relative to the number of newly unemployed individuals, defined as those out of work less than five weeks. This figure also displays the actual values and a smoothed trend line. What then accounts for this reversal in long-term UI recipiency trends?
Assessing the recent increase
Figure 2
UI recipiency rate among the newly unemployed

Note: Ratio of new UI claims to the number of workers unemployed less than five weeks (three-month average).
One possible explanation for rising UI recipiency rates is easier filing. Over most of the program’s history, UI claimants generally were required to file in person at local UI offices. Beginning in the mid-1990s, states began switching to phone filing, followed shortly thereafter by Internet filing. By 2005, most states accepted UI claims via phone or Internet, and had closed local offices, increasing the ease and lowering the cost of filing for benefits (Ebenstein and Stange 2008). However, using comprehensive data for all states from 1989 to 2006 and a careful research design that relied on the exact timing of state changes in filing procedures, Ebenstein and Stange found virtually no evidence to support the hypothesis that the shift to easier filing methods boosted recipiency rates.
An alternative explanation relates to the changing composition of the unemployment pool. In the CPS, the unemployed are categorized into four groups based on the reason they became unemployed: new entrants to the labor force, reentrants to the labor force, voluntary job leavers, and job losers due to permanent and temporary layoffs, firings for cause, or completion of temporary positions. The first three groups generally are ineligible for UI compensation because they do not meet the base earnings thresholds and the requirement of involuntary job loss.
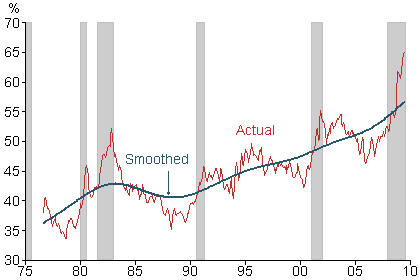
Over time, however, the composition of the unemployment pool has shifted away from these ineligible groups and toward job losers. The shift primarily reflects a declining share of labor force entrants in the unemployment pool. This in turn results from the declining share of young workers in the labor force and the increasingly consistent labor force attachment of women (Abraham and Shimer 2002). The resulting increase in the share of job losers in the unemployment pool can be seen in Figure 3, which depicts the share of this group among newly unemployed individuals since 1976. At the start of the period, job losers constituted about 40% of the newly unemployed on average. Since then, the underlying trend has been upward, reaching a recent high of 65%. The resulting increase in the share of job losers in overall unemployment directly increased UI recipiency among the unemployed by increasing the percentage of workers who are eligible for benefits.
Figure 3
Job losers’ share of the newly unemployed

Note: Ratio of job losers unemployed less than five weeks to the
total number of those unemployed less than five weeks (three-month average)
This discussion raises the question of why we see a more pronounced upward trend in the ratio of new UI claims to the newly unemployed (Figure 2) than we see for the ratio of continuing claims to the total number unemployed (Figure 1). The explanation relates to a side effect of the rising share of job losers in the unemployment pool. Because job losers on average endure longer unemployment spells than do individuals unemployed for other reasons, the rising share of job losers has contributed to an increase in typical unemployment durations over the past few decades (Valletta 2005). Individuals with short expected unemployment durations often do not file UI claims. As a result, rising expected durations causes a higher incidence of initial claims among the newly unemployed. However, at the same time, the rising incidence of long spells of unemployment of 26 weeks or more causes an increasing number of filers to exhaust benefits. That causes the upward trend in overall UI recipiency to fall short of the upward trend for new filers.
Current claims
As of early June 2009, the number of ongoing UI claims had reached about 6.8 million, the highest level ever recorded. The number of initial claims appears to have peaked in March 2009 at a level that is very close to the historical high reached in late 1982. As a share of the labor force, however, both series remain well below their historical peaks. This partly reflects a downward trend in UI recipiency evident after the mid-1970s, which was not fully offset by the subsequent upward trend arising from an increased share of job losers in overall unemployment. The net impact of these long-term trends has been to mildly offset UI’s role as an automatic stabilizer for the economy. Moreover, most forecasters expect the current labor market weakness to continue for many more months. If this occurs, the resulting rise in unemployment durations will cause some UI claimants to exhaust their regular and extended benefits, which will further offset the intended roles of UI payments as an automatic stabilizer and means of low-income support.
References
Abraham, Katharine, and Robert Shimer. 2002. “Changes in Unemployment Duration and Labor Force Attachment.” In The Roaring Nineties, eds. Alan Krueger and Robert Solow. New York: Russell Sage Foundation.
Anderson, Patricia M., and Bruce D. Meyer. 1997. “Unemployment Insurance Takeup Rates and the After-Tax Value of Benefits. The Quarterly Journal of Economics 112(3) pp. 913–937.
Blank, Rebecca M., and David E. Card. 1991. “Recent Trends in Insured and Uninsured Unemployment: Is There an Explanation?” The Quarterly Journal of Economics 106(4) pp. 1157–1189.
Ebenstein, Abraham, and Kevin Stange. 2008. “Does Inconvenience Explain Low Take-up? Evidence from UI Claiming Procedures.” Working paper, University of Michigan (December).
U.S. House of Representatives, Committee on Ways and Means. “2008 Green Book, Background Material and Data on Programs within the Jurisdiction of the Committee on Ways and Means.” 110th Congress. Washington, DC: U.S. Government Printing Office.
Valletta, Robert G. 2005. “Rising Unemployment Duration in the United States: Causes and Consequences.” Manuscript, Federal Reserve Bank of San Francisco (May).
Opinions expressed in FRBSF Economic Letter do not necessarily reflect the views of the management of the Federal Reserve Bank of San Francisco or of the Board of Governors of the Federal Reserve System. This publication is edited by Anita Todd and Karen Barnes. Permission to reprint portions of articles or whole articles must be obtained in writing. Please send editorial comments and requests for reprint permission to research.library@sf.frb.org