Mortgage lenders impose a default premium on the loans they originate to compensate for the possibility that borrowers won’t make payments. The housing boom of the 2000s was characterized by increasing riskiness of the borrowers approved for mortgages and the structures of the loans themselves. Despite these changes in risk, a pricing model can justify the spreads contained in mortgages made during this period based on what at the time seemed to be reasonable expectations for house price appreciation. Contrary to those expectations, prices fell dramatically.
One of the enduring questions about the housing market of the past decade is the role of lax lender underwriting standards and pricing of risk in the lead-up to the collapse of home prices and wave of defaults that began in 2007. This Economic Letter seeks to shed light on those issues by examining how lenders price the risk that a mortgage borrower will default. Specifically, we look at how default premiums behaved during the housing boom years of the past decade.
Declining standards and loan prices
Throughout the housing market boom of the 2000s, the risk characteristics of the average mortgage borrower steadily increased. Moreover, mortgage loans themselves became riskier. Subprime loans as a percentage of total mortgages rose dramatically. Documentation of borrower income, assets, and employment status generally slipped. Average loan-to-value ratios increased. Alternative mortgage products with features that slowed or eliminated the build-up of borrower equity over time, such as interest-only mortgages and option adjustable-rate mortgages, gained market share, especially in places that had experienced above-average house price appreciation (see Demyanyk and van Hemert 2009).
Did default premiums adjust to reflect the growing accumulation of borrower risk? First, a definition: Default risk premium is the difference between the rate at origination for a mortgage of a given loan-to-value ratio and the rate on a U.S. Treasury security of comparable maturity. Positive default premiums represent the compensation for risk that borrowers pay to lenders. To determine whether default premiums adjusted to reflect the greater riskiness of mortgage loans during the 2000s, we need an asset pricing model. Krainer, LeRoy, and O (2009) have developed a model that can be used to evaluate mortgage loan rates, given reasonable assumptions about the future path of house prices. Their model belongs to the class of what are called structural models. That is, mortgage default is not treated as a random event precipitated by a life circumstance, such as job loss, illness, or divorce, all of which follow known probability distributions. Rather, default is typically considered to be a strategic event that occurs when a borrower decides that the cost of continuing mortgage payments, less the value of housing services or rental income, exceeds the expected value of future capital gains (see Krainer and LeRoy 2010).
Krainer, LeRoy, and O ask what profit-maximizing lenders will charge for mortgages with different loan-to-value ratios, given that a borrower can be expected to default when the value of his or her home drops below the rational default point. That default point, in turn, depends on loan terms and expectations regarding future home price appreciation. Both the default risk premium and the borrower’s default point are determined simultaneously in the model equilibrium. Assuming that lenders behave competitively and can freely enter and exit the mortgage lending business, the equilibrium default premium exactly compensates lenders for the risk that the borrower will default.
In order to make the model easier to work with, the authors make several assumptions. For analytical convenience, mortgages are assumed to be perpetuities (loans with no maturity date) with fixed interest rates. That is, scheduled principal payments are assumed to be zero, a reasonable approximation of the first several years of amortization on a 30-year fixed-rate mortgage. Borrowers and lenders are assumed to be risk neutral, meaning that they value assets by taking probability-weighted averages of future payoffs and discounting those expected payoffs to the present.
Finally, the authors abstract away interest rate risk, focusing instead on the default risk inherent in mortgages with different loan-to-value ratios. This assumption does not imply that interest rate risk isn’t important. Indeed, the earlier mortgage pricing literature focuses almost exclusively on interest rate risk (see Brennan and Schwartz 1985). Rather, it is assumed that interest rate risk does not interact with default risk in a way that would affect the pricing of mortgages with different loan-to-value ratios. Given these assumptions, the model’s pricing results apply best to 30-year fixed-rate loans because such mortgages are long lived with very little amortization of principal in the early years. Adjustable-rate mortgages, while very important, are much harder to analyze because of the way that mortgage payments change over time, reflecting movements of interest rates and house prices.
To account for factors other than house price changes that affect default, the Krainer, LeRoy, and O model allows for both borrower and lender default costs. These are modeled separately because they affect mortgage pricing and mortgage default in very different ways. Borrower default costs include the expenses of moving and costs associated with lower credit ratings. However, after borrowers stop making mortgage payments, they can continue to occupy their homes rent free for up to a year in some states, an obvious benefit to borrowers and cost to lenders.
Figure 1
Mortgage risk premiums and loan-to-value ratios

Note: Default costs are assumed to be 20% of original house price.
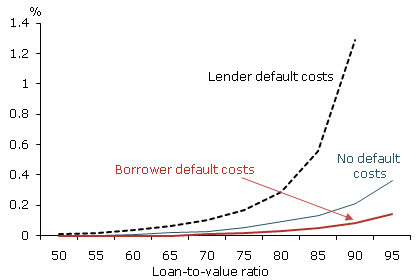
Figure 1 plots the default premiums implied by this model as they vary with mortgage loan-to-value ratios. In the figure, expected house price appreciation is 6% and the expected volatility of house price appreciation is 10%. The figure shows three plots, the first assuming no default costs, the second allowing for borrower default costs, and the third allowing for lender default costs. In the latter two cases, the assumed costs are 20% of original home value.
Each curve slopes upward. For very low loan-to-value ratios, the required compensation for default risk is quite low, just a few hundredths of a percentage point. This makes sense, given the expectation that house prices will rise and the large amounts of homeowner equity already in place. Default is considered very unlikely because rational borrowers will default only after a large—and unlikely—price drop. At higher loan-to-value ratios, the probability of default goes up because rational borrowers will default after smaller price drops. As a result, required lender compensation shoots up.
Note that borrower and lender default costs push the curves in opposite directions. Borrower default costs induce homeowners to default only at lower house values. Lenders, aware that default risk is lower, are willing to charge lower default premiums at each loan-to-value ratio compared with the case in which default costs are zero. In contrast, lender default costs do not directly affect the borrower’s default point. Instead, for a given default risk premium, lender default costs induce originators to require higher borrower down payments or, stated another way, lower loan-to-value ratios compared with the zero default costs case.
The other key determinant of default risk premiums in the model is the volatility of house price changes, meaning possible variations in future house prices. Mortgage borrowers tend to value house price volatility. As homeowners, they clearly benefit when house prices rise. At the same time, they are somewhat protected from downward price movements because they have the option to default. Lenders recognize that greater house price volatility increases the value of the borrower default option. Accordingly, when house price volatility is high, they impose higher default premiums.
Another look at data on loan pricing
Figure 2
Spreads on fixed-rate mortgages as a function of loan-to-value ratios

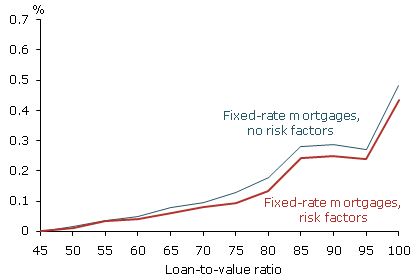
Is this theoretical relationship between loan-to-value ratios and default premiums supported by mortgage data? Figure 2 shows the average loan spreads from a sample of California fixed-rate mortgages originated from 2000 to 2008. The figure plots two versions of the average relationship between default premium and loan-to-value ratio. One version controls for risk factors such as credit score, subprime status, and the market where the property is situated. The other version lacks such controls. Somewhat surprisingly the two curves are virtually identical, suggesting that these risk factors do not interact much with loan-to-value ratios in determining default premiums.
Qualitatively, the empirical loan-to-value spread curve in Figure 2 is shaped quite similarly to the theoretical curves in Figure 1. Low loan-to-value mortgages in the data have very low spreads, typically a few hundredths of a percentage point, until loan-to-value ratios of about 70% are reached. At that point, as in Figure 1, the estimated spread rises at an increasing rate. For the highest loan-to-value mortgages in our sample of California fixed-rate mortgages, lenders apparently required an extra 0.5 percentage point above the rates given to low loan-to-value borrowers.
Figure 2 suggests that the qualitative features of the theory, such as the shape of the loan-to-value/default premium relationship, seem to be present in the data. It turns out that reasonable model parameter choices can generate the same 0.50 percentage point differential between the spreads on high and low loan-to-value loans that we saw in Figure 2. Specifically, if we assume 15% annual volatility in house price movements, a 3% average house price appreciation rate, and borrower default costs of 15% to 20% of the original loan amount, then the model can match the actual default premiums charged by lenders in the run-up to the housing market crash.
But were assumptions of average 3% house price appreciation and 15% annual volatility reasonable? Such assumptions would not have been considered overly optimistic during the 2000–07 sample period of the study. According to house price data compiled at the metropolitan statistical area level for the period leading up to the loan originations in our sample, the average appreciation rates were 4.7% and average volatilities were 12.8% in the California markets that we study. Of course, in reality, house prices fell dramatically in the last few years of the 2000s, wildly different than these earlier numbers. Assumptions that may have seemed reasonable at the time were not borne out.
Conclusion
In this Economic Letter, we study one part of the chain of decisions that eventually led to the large losses on mortgages and mortgage-related assets in 2008 and beyond, namely, the pricing of mortgage loans at origination. Our results contain good news and bad news. The good news is that, in the sample used in this study, we find some evidence of rational mortgage pricing. The bad news is that this conclusion of rational pricing is predicated on assumptions about underlying house prices that may have seemed reasonable at the time the loans were made, but proved to be disastrously inaccurate after the fact.
References
Brennan, Michael, and Eduardo Schwartz. 1985. “Determinants of GNMA Mortgage Prices.” Journal of AREUEA 13(3), pp. 209–228.
Demyanyk, Yuliya, and Otto Van Hemert. 2009. “Understanding the Subprime Mortgage Crisis.” Review of Financial Studies, first published online May 4.
Krainer, John, and Stephen LeRoy. 2010. “Underwater Mortgages.” FRBSF Economic Letter 2010-31 (October 18). /economic-research/letter/2010/el2010-31.html
Krainer, John, Stephen LeRoy, and Munpyung O. 2009. “Mortgage Default and Mortgage Valuation.” FRBSF Working Paper 2009-20. http://www.federalreservebanksf.org/economic-research/papers/2009/wp09-20bk.pdf
Opinions expressed in FRBSF Economic Letter do not necessarily reflect the views of the management of the Federal Reserve Bank of San Francisco or of the Board of Governors of the Federal Reserve System. This publication is edited by Anita Todd and Karen Barnes. Permission to reprint portions of articles or whole articles must be obtained in writing. Please send editorial comments and requests for reprint permission to research.library@sf.frb.org