Despite historically low mortgage interest rates, borrower prepayments have been lower than expected over the past year. For example, a model based on prepayment data from 2000 through the beginning of 2009 predicts a prepayment rate for the first quarter of 2010 roughly twice as high as the observed rate. It can be conjectured that current low prepayment rates reflect the influence of factors specific to the housing bust, including a significant tightening of lending terms for certain borrowers, weak housing demand, and high foreclosure rates.
All mortgage borrowers have the option of prepaying their loans, possibly with a penalty, even if they do not intend to sell their homes. In almost all cases in which a home is not sold, prepayment is associated with refinancing the underlying mortgage. Borrowers might have a number of motives for refinancing. Most obviously, mortgage interest rates may have declined enough to make refinancing worthwhile. In such cases, the borrower can lower the discounted present value of the payment liability by switching into a lower rate.
However, the refinancing decision is not quite as straightforward as simply comparing the present value of the remaining mortgage balance under the existing rate with that of a new mortgage under the current market rate, net of transaction costs. Like any financial option, timing is important. If you refinance today, the decision may preclude you from refinancing at a later date when rates might be even lower. Thus, some measure of mortgage interest rate volatility is also necessary for calculating the advantage of refinancing (see Agarwal, Driscoll, and Laibson 2008 for a mortgage calculator that factors in these considerations).
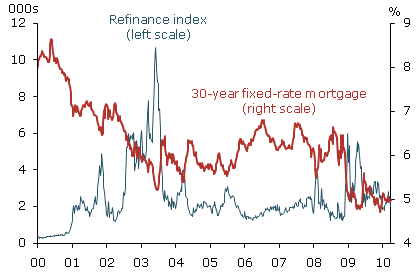
In general, mortgage borrowers are sensitive to interest rate changes. If we look at prepayments over time, as measured by the Mortgage Bankers Association’s refinancing index, we see a negative relationship between the overall level of interest rates and the level of refinancing activity (see Figure 1).
Figure 1
Mortgage interest rate and refinance index

Source: FAME database.
Despite this basic relationship in the aggregate data, the mortgage finance literature is replete with empirical evidence documenting how individual mortgage borrowers often don’t follow optimal prepayment strategies. Many borrowers don’t prepay and refinance when it is advantageous to do so (see Green and LaCour-Little 1999). Similarly, there is also evidence that some borrowers prepay even when it would not seem to be optimal. This has led observers to consider a wider array of prepayment motives than simply reducing the interest rate on the remaining principal balance. It is possible that some borrowers prepay their mortgages not just to refinance and lower their rate, but also to extract equity. This behavior may be more closely related to liquidity needs, such as financing college for their children, than to the level of interest rates.
Additionally, house price appreciation adds to borrower wealth and can have the effect of reducing a borrower’s loan-to-value ratio. If borrowers are comfortable with a certain level of leverage, then changes in house prices may prompt them to prepay even though there is little incentive to do so from the narrower perspective of interest costs. Likewise, house price declines effectively raise loan-to-value ratios and thus tend to depress refinancing because borrowers may no longer have enough equity to qualify for the same kind of loan they previously took out.
Of course, one of the main reasons for prepaying a mortgage is the sale of the home, which is not related to refinancing. Job changes may force borrowers to move. Young households may trade up to more expensive homes. Older households may downsize. Household members may experience job loss, divorce, or other life events that induce them to sell their homes. All of these motives might lead to mortgage prepayment for reasons that have nothing to do with interest rates or house prices alone (see Green and Shoven 1986 for a discussion of how individual borrower characteristics are important for explaining prepayments).
Using data to explain the recent mortgage prepayment behavior
Despite the complex set of factors that govern mortgage prepayment decisions, the broad swings in prepayment behavior can be captured reasonably well using a simple statistical model that takes into account the factors noted above. Formally, we use here what is known as a competing risks survival model. The survival risks are “competing” in the sense that mortgages can terminate in two different ways: borrowers can prepay, or they can go into default or foreclosure. We use loan-level data from LPS Applied Analytics, specifically a random sample of 75,784 first-lien owner-occupied mortgages with closing dates from January 2000 to March 2010. We identify prepayments as events in which mortgage balances are paid off in full without foreclosure taking place. Because of possible differences between borrowers who take out adjustable-rate mortgages and fixed-rate mortgages, we ran the two groups through our model separately. In addition to current loan-to-value ratios and the difference between existing mortgage interest rates and market rates, we also include a measure of interest rate volatility (a term premium) as well as control variables for mortgage characteristics such as jumbo, subprime, and low-documentation loans. Additionally, we control for the types of investors that own the loan, in the event that mortgages sold to private investors differ in hard-to-measure ways from mortgages owned or guaranteed by Fannie Mae or Freddie Mac. Finally, we include the unemployment rate for the metropolitan statistical area in which a home is located.
As expected, the most important variables in predicting prepayment rates relate to the costs of mortgages. In our sample, we find subprime mortgage borrowers are much less likely to prepay than prime mortgage borrowers. In addition, jumbo mortgage borrowers are less likely to prepay than conforming mortgage borrowers. We also find mortgages held by private investors are less likely to be prepaid than mortgages held by Fannie Mae or Freddie Mac.
Figure 2
Fixed-rate mortgage prepayment rates

Source: LPS Analytics and authors’ calculations.
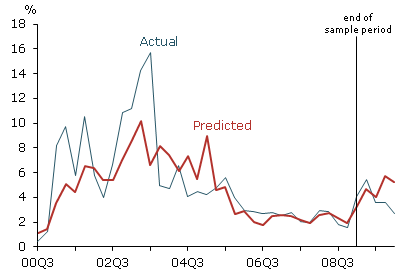
In Figure 2, actual fixed-rate mortgage prepayment rates are plotted side-by-side with rates predicted by our model starting in the third quarter of 2000. Thus, for example, in the first quarter of 2002, approximately 6.5% of all fixed-rate mortgages in our sample were predicted to prepay. This calculation is done by computing the prepayment probability for each mortgage in the sample and then averaging these probabilities to get an expected prepayment rate. The thin blue line in Figure 2 is the actual prepayment rate, which was a little below 5.75% for the first quarter of 2002.
Overall, the model appears to capture the basic patterns in the data. Specifically, predicted prepayment rates track actual prepayment rates in 2003 when mortgage interest rates fell. The model doesn’t capture the full magnitude of the high prepayments in 2003–2004, either because borrowers were even more sensitive to rate declines during those years than this simple model indicates or because borrowers were in part basing their prepayment decisions on liquidity needs, which are difficult to measure. This period coincides with a housing market boom and the high prepayment rates may also reflect the strong housing demand at that time as households traded up.
The vertical line toward the right margin of Figure 2 marks the end of the sample period used for estimating the model. To the right of the vertical line, we fix the model parameters and feed in actual interest rates, house prices, and unemployment rates for the mortgages that were still current at the end of the estimation period and beyond. Technically, the predicted prepayment rates between the second quarter of 2009 and the first quarter of 2010 are not forecasts because the variables used to construct the predictions for this period are known. But the model does not incorporate data on prepayment rates and other variables over the past year.
We chose to estimate the model based on previous-period data because of the possibility that mortgage markets have undergone a regime shift. Indeed, since the summer of 2008, Fannie Mae and Freddie Mac both went into conservatorship, the nonagency securitization market effectively shut down, and bank lending standards tightened amid financial crisis. So the predicted prepayment rates for the current period are predicated on the kind of prepayment experience we might have expected if rates and house prices followed their actual paths and the seismic changes in the mortgage market had not occurred.
The notable thing about the model’s out-of-sample prediction is that it diverges from the actual prepayment rate. Given the current values of the variables that go into the prepayment model, we would expect the prepayment rate for the fixed-rate mortgages in our sample to be 5.26% in the first quarter of 2010. In fact, the prepayment rate was closer to 2.5% in that period for both fixed and adjustable-rate mortgages, which are not shown in Figure 2. Given the number of mortgages outstanding in the first quarter of 2010, this translates into about 1.2 million mortgages not prepaid that the model predicts would have been prepaid. Evidently, the usual rise in prepayments that accompanies a prolonged period of low interest rates was offset by some other factor or combination of factors.
Figure 3
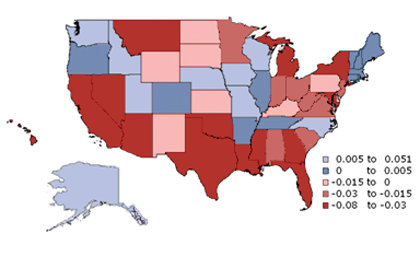
Difference in prepayment rate by state

Note: Actual refinance rate minus model’s prediction.
House price declines are not likely to be the culprit because these changes are accounted for in the model. Since the overall model fit is fairly good, something outside the model is apparently holding down prepayment rates. This deviation is also consistent with a relative tightening of conditions in the mortgage market. Indeed, our measure of the value of the prepayment option is largely driven by how far a benchmark interest rate has fallen relative to borrowers’ current interest rates. It may be that these existing rates were abnormally cheap relative to the benchmark rate at the time of origination. It could also be that more borrowers were able to get low rates that are no longer available to as many borrowers in our sample because of tighter lending standards. Another possibility is that the low prepayment rates are related to the current high mortgage default rates. With housing market conditions so weak, as borrowers fall behind on their mortgages, they may be finding it difficult to sell their homes and avoid default. Indeed, we can use this same basic model to predict the mortgage default rate over this same time period. This exercise would indicate that actual default or foreclosure rates are currently higher than predicted by the model.
Figure 3 shows the difference by state of our model’s predicted prepayment rate minus the actual prepayment rate. Our model predicted 3 to 8% more prepayments in California than there actually were from the second quarter of 2009 through the first quarter of 2010. Unsurprisingly, California, Nevada, and Arizona, three states with very high mortgage default rates, had significantly fewer prepayments than our model predicts.
Conclusion
Mortgage interest rates are currently at historically low levels. Despite attractive rates, we have not seen the level of mortgage prepayment that would normally be expected. This seems to reflect the presence of a number of unusual factors that a standard mortgage prepayment model cannot capture. These missing factors may include a possible tightening of mortgage terms for borrowers who previously enjoyed much easier access to credit, and weak housing demand that is suppressing the trade-up market and preventing distressed borrowers from selling their houses and avoiding foreclosure.
References
Agarwal, Sumit, John Driscoll, and David Laibson. 2008. “Optimal Mortgage Refinancing: A Closed Form Solution.” Harvard University and NBER working paper.
Green, Jerry, and John Shoven. 1986. “The Effects of Interest Rates on Mortgage Prepayments.” Journal of Money, Credit, and Banking 18(1), 41–59.
Green, Richard, and Michael LaCour-Little. 1999. “Some Truths about Ostriches: Who Doesn’t Prepay Their Mortgages and Why They Don’t.” Journal of Housing Economics 8(3), pp. 233–248.
Opinions expressed in FRBSF Economic Letter do not necessarily reflect the views of the management of the Federal Reserve Bank of San Francisco or of the Board of Governors of the Federal Reserve System. This publication is edited by Anita Todd and Karen Barnes. Permission to reprint portions of articles or whole articles must be obtained in writing. Please send editorial comments and requests for reprint permission to research.library@sf.frb.org