The current economic recovery is proceeding at a tepid pace despite massive federal fiscal stimulus and extremely low interest rates. Forecasts derived from business cycle indicators produced by the Chicago and Philadelphia Federal Reserve Banks predict that real U.S. GDP growth through the first half of 2011 will remain at or below potential. If these forecasts prove accurate, then the historical relationship between real GDP growth and the labor market suggests that the unemployment rate could rise by as much as 0.5 percentage point during this period.
The National Bureau of Economic Research Business Cycle Dating Committee has determined that the recent recession ended in June 2009. Since then, the U.S. economy has recorded four consecutive quarters of positive real GDP growth. During this period, inventory accumulation by businesses accounted for more than half the growth, while real final sales of domestically produced goods and services grew only at an annual 1.1% rate on average. Due to the severity of the recession and the lackluster nature of the recovery so far, the level of real GDP at the end of the second quarter of 2010 was still 1.3% below the pre-recession peak reached more than 2½ years ago.
Recent weaker-than-expected economic data have raised concerns about the recovery’s staying power. In a recent Economic Letter, Berge and Jorda (2010) estimate the probability of falling back into recession during the next two years at around 50%. While discussions in the media often focus on the likelihood of a “double dip,” it is important to recognize that, even if the economy avoids another recession, future real GDP growth may not be strong enough to prevent the unemployment rate from rising. Standard macroeconomic models would predict an increase in the unemployment rate if real GDP growth over the next two to four quarters were to fall below the economy’s potential growth rate, defined as the sum of the long-run trend growth rates of productivity and the labor force. The Congressional Budget Office (CBO 2010) estimates that the U.S. economy’s potential annual growth rate over the next five years is 2.1%. Other estimates of potential growth are significantly higher. If real GDP growth were to fall below potential growth for a sustained period, then the unemployment rate would be expected to rise.
In this Economic Letter, we use two well-known business cycle indicators to help forecast real GDP growth two to four quarters ahead. According to our empirical forecasting models, real GDP growth will remain at or below estimates of potential growth through the first half of 2011, implying a significant risk of rising unemployment.
Two indicators of economic activity
Figure 1
Chicago Fed National Activity Index

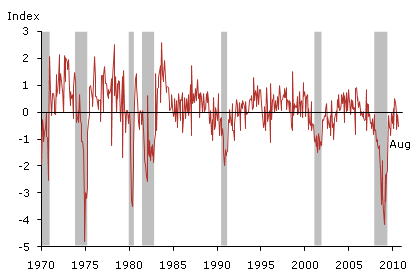
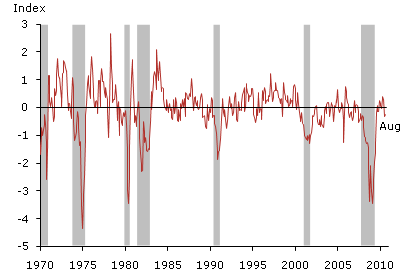
The Federal Reserve Banks of Chicago and Philadelphia both produce business cycle indicators designed to gauge current and future economic activity. Known respectively as the Chicago Fed National Activity Index (CFNAI) and the Aruoba-Diebold-Scotti (ADS) index, they are plotted in Figures 1 and 2. Both indicators are constructed by condensing a wide range of economic data into a single index that summarizes business cycle conditions.
The monthly CFNAI has proved useful as an early indicator of recessions (see Evans, Liu, and Pham Kanter 2002 and Brave 2009). It is distilled from 85 monthly series drawn from four broad data categories: consumption and housing; employment, unemployment, and hours worked; sales, orders, and inventories; and production and income. The index is constructed to have an average value of zero, with a positive reading indicating growth above trend and a negative reading indicating growth below trend.
Figure 2
Philadelphia Fed’s ADS Business Conditions Index

Figure 1 shows that the CFNAI recorded extreme negative readings during the recent recession, but bounced back sharply during the second half of 2009. However, in recent months the index’s rebound has stalled. The index recorded three consecutive negative readings for June, July, and August.
The ADS index is distilled from six different data series, including the weekly series on initial claims for unemployment insurance; the monthly series for payroll employment, manufacturing and trade sales, industrial production, and personal income less transfer payments; and the quarterly series on real GDP growth. The index is updated each time a new piece of data is released. Its average value is zero, with positive readings indicating better-than-average conditions and negative readings indicating worse-than-average conditions. Like the CFNAI, the ADS index’s monthly average value can be used as a real-time recession indicator (see Jorda 2010).
Figure 2 shows that the ADS index has exhibited a pattern similar to the CFNAI in recent months. The average reading for June turned negative followed by average readings closer to zero, but still negative, in July and August.
Empirical forecasting models for real GDP growth
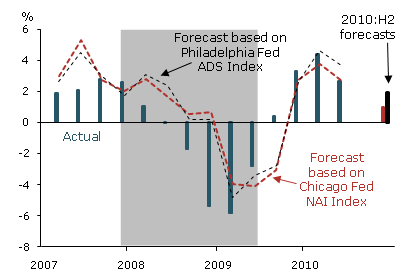
Historically, both the CFNAI and the ADS index started declining prior to the onset of past recessions. Both indicators may be useful not just in forecasting recessions, but also in projecting the magnitude of real GDP growth in future quarters. To assess the power of these indicators to predict growth, we construct simple empirical models that use data from the first quarter of 1972 through the second quarter of 2010. We perform a regression, a statistical exercise in which we look at the relationship between the two-quarter moving average of real GDP growth and four explanatory variables dated at least two quarters earlier. For example, average growth in the third and fourth quarters of 2010 would be predicted using variables that pertain to the second quarter of 2010 or earlier. The explanatory variables are the end-of-quarter monthly value of the CFNAI or ADS index; the change in the same index from the previous quarter; the quarterly change in the end-of-quarter monthly average of the Standard & Poor’s 500 stock index; and the quarterly change in the end-of-quarter monthly average yield of the 10-year Treasury bond. A similar exercise is performed using the four-quarter moving average of real GDP growth and the same set of explanatory variables dated at least four quarters earlier.
Figure 3
Two-quarter GDP growth, actual and forecasted values

The monthly value of the CFNAI or ADS index at the end of the quarter provides a gauge of recent economic data, whereas the change from the previous quarter indicates whether the data are improving or deteriorating. Given that financial markets are forward looking, the quarterly changes in stock prices and long-term Treasury yields measure the degree to which recent data may have shifted investor expectations about the future. All these variables are statistically significant in helping explain real GDP growth two to four quarters ahead. The two-quarter-ahead forecasting models explain about 50% of the variance of real GDP growth since 1972, while the four-quarter-ahead models explain about 30% of the variance.
Figure 3 plots forecasts from the two-quarter-ahead models versus the two-quarter moving average of real GDP growth from 2007 to 2010. Both forecasts track the actual data fairly well through the first half of 2010, but with a lag, which is typical when current and past data are used to make predictions about the future. For the second half of 2010, the CFNAI model predicts an average growth rate of 1.0%, while the ADS model predicts an average growth rate of 1.9%. The four-quarter-ahead CFNAI model predicts average growth rates through the first half of 2011 of 1.6% and the four-quarter-ahead ADS model predicts 2.2%. By contrast, the most-recent Blue Chip consensus forecast is for 2% growth in the second half of 2010 and 2.3% through the first half of 2011.
Implications of below-potential growth for the unemployment rate
If we accept the CBO’s 2.1% potential growth estimate, then the CFNAI model is predicting lower-than-potential growth through the second quarter of 2011. The ADS model is predicting lower-than-potential growth in the second half of 2010, but anticipates that growth through the 2011 second quarter will approximately equal potential growth. Comparing these forecasts with the CBO’s potential growth estimate, a standard macroeconomic model would predict rising or sideways movement in the unemployment rate over the next year. All else equal, a higher estimate for potential growth would imply a more pronounced rise in the unemployment rate for a given below-potential growth forecast.
Figure 4
Okun’s law, 1972-2009

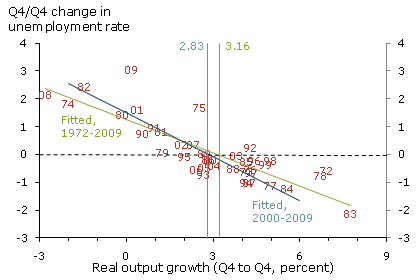
Figure 4 plots yearly real GDP growth rates versus the corresponding yearly changes in the unemployment rate. The statistical relationship between the two variables is often called “Okun’s law,” a rule of thumb holding that changes in the unemployment rate move in more or less predictable ways with changes in real GDP. The years 1975 and 2009 stand out as examples in which the unemployment rate increased by much more than would have been expected given the historical statistical relationship with real GDP growth. Daly and Hobijn (2010) suggest that the unexpected jump in the 2009 unemployment rate may have been partially due to aggressive cost-cutting strategies by businesses in response to a dramatic rise in economic uncertainty.
Figure 4 shows that, on average since 1972, the unemployment rate has tended to increase whenever the yearly real GDP growth rate has fallen below approximately 3%. This alternative estimate of potential growth is significantly higher than the CBO’s 2.1% estimate. The results are little changed if we consider only data from 2000 to 2009.
Averaging the four-quarter-ahead CFNAI and ADS models produces a growth forecast of 1.9% through the second quarter of 2011. If this growth forecast proves accurate, then the historical Okun’s law relationship would predict a corresponding 0.5 percentage point rise in the unemployment rate over the next year, from the current 9.6% to 10.1%. Such a scenario would take the unemployment rate back to the peak recorded in October 2009. If instead we use the 2.3% Blue Chip consensus growth forecast, then Okun’s law predicts a smaller rise of approximately 0.35 percentage point in the unemployment rate.
Conclusion
Conventional wisdom holds that severe recessions are typically followed by rapid recoveries. But more than a year after the end of the most severe recession since 1947, the recovery is proceeding at a tepid pace. This is happening despite massive federal fiscal stimulus and extremely low interest rates. Forecasts derived from the Chicago and Philadelphia Fed business cycle indicators predict that real GDP growth through the first half of 2011 will remain at or below potential. When translated into a forecast for the labor market, our analysis suggests that the unemployment rate could rise anywhere from 0 to 0.5 percentage point during this period.
A sluggish recovery should perhaps be expected. The recent recession was preceded by a decade-long consumption and housing boom financed by an unsustainable run-up in household debt relative to income (see Lansing 2005). Current efforts to stimulate consumer spending with low interest rates may be less effective than in the past because households remain overleveraged (see Glick and Lansing 2009). In a comprehensive historical review of periods leading up to financial crises and their aftermath, Reinhart and Reinhart (2010) find that episodes of prosperity that are fueled by easy credit and rising debt are typically followed by lengthy periods of deleveraging characterized by subdued growth in GDP and employment.
References
Berge, T.J., and O. Jorda. 2010. “Future Recession Risks.” FRBSF Economic Letter 2010-24 (August 9).
Brave, S. 2009. “The Chicago Fed National Activity Index and Business Cycles.” Chicago Fed Letter 268 (November).
Daly, M., and B. Hobijn, 2010. “Okun’s Law and the Unemployment Surprise of 2009.” FRBSF Economic Letter 2010-07 (March 8).
Evans, C.L., C.T. Liu, and G. Pham-Kanter. 2002 “The 2001 Recession and the Chicago Fed National Activity Index: Identifying Business Cycle Turning Points.” FRB Chicago, Economic Perspectives, 3rd Quarter, pp. 26-43.
Glick, R., and K.J Lansing. 2009. “U.S. Household Deleveraging and Future Consumption Growth.” FRBSF Economic Letter 2009-16 (May 15).
Jorda, O. 2009. “Diagnosing Recessions.” FRBSF Economic Letter 2010-05 (February 16).
Lansing, K.J. 2005. “Spendthrift Nation.” FRBSF Economic Letter 2005-30 (November 10).
Reinhart, C.M., and V. Reinhart, 2010. “After the Fall.” Paper presented at symposium sponsored by FRB Kansas City, Jackson Hole, Wyoming (August).
U.S. Congressional Budget Office. “The Budget and Economic Outlook: An Update.” 2010. (August).
Opinions expressed in FRBSF Economic Letter do not necessarily reflect the views of the management of the Federal Reserve Bank of San Francisco or of the Board of Governors of the Federal Reserve System. This publication is edited by Anita Todd and Karen Barnes. Permission to reprint portions of articles or whole articles must be obtained in writing. Please send editorial comments and requests for reprint permission to research.library@sf.frb.org