The Great Recession of 2007-2009, coming on the heels of a spending binge fueled by a housing bubble, so far has resulted in over $7,300 in foregone consumption per person, or about $175 per person per month. The recession has had many costs, including negative impacts on labor and housing markets, and lost government tax revenues. The extensive harm of this episode raises the question of whether policymakers could have done more to avoid the crisis.
In the mid-2000s, an enormous speculative housing bubble emerged in the United States. An accommodative interest rate environment, lax lending standards, ineffective mortgage regulation, and unchecked growth of loan securitization all fueled an overexpansion of consumer borrowing. An influx of new and often unsophisticated homebuyers with access to easy credit helped bid up house prices to unprecedented levels relative to rents or disposable income. Equity extracted from rapidly appreciating home values provided households with hundreds of billions of dollars per year in spendable cash, significantly boosting consumer spending. The consumption binge was accompanied by a rapid increase in household debt relative to income and a decline in the personal saving rate (see Lansing 2005).
The persistent rise in home values encouraged lenders to ease credit even further on the assumption that house price appreciation would continue. But when these optimistic projections failed to materialize, the bubble began to deflate, setting off a chain of events that led to a financial and economic crisis. The “Great Recession,” which started in December 2007 and ended in June 2009, was the most severe economic contraction since 1947 as measured by the peak-to-trough decline in real GDP.
The Great Recession triggered a dramatic shift in household spending behavior. Real personal consumption expenditures trended down for six quarters, the personal saving rate more than tripled from around 2% to over 6%, and households began a sustained deleveraging process that is still under way (see Glick and Lansing 2009).
This Economic Letter estimates the amount of consumption lost from the Great Recession by comparing the actual trajectory of real personal consumption expenditures to its pre-recession trend. The amount turns out to be quite large. From December 2007 through May 2011, foregone consumption per person was over $7,300, or about $175 per person per month.
Comparing the Great Recession to prior recessions
Figure 1
Real personal consumption expenditures per person

Note: Indexed to 100 at business cycle peak, seasonally adjusted.
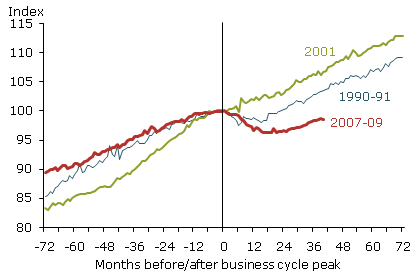
Figure 1 compares the trajectory of monthly real personal consumption expenditures per person during the Great Recession with the corresponding trajectories for the two prior recessions of 2001 and 1990–91. The 1990–91 recession was triggered by the combination of an oil price shock and a credit crunch (see Walsh 1993). It took 23 months for consumption per person to return to its pre-recession peak. In contrast, as of May 2011, 42 months have elapsed since the start of the Great Recession and consumption per person is still 1.6% below its pre-recession peak.
The 2001 recession stemmed from the unwinding of excess business investment in the aftermath of a burst U.S. stock market bubble (see Lansing 2003a). The recession departed from the typical business cycle pattern because real consumption per person continued upward. Consumption was supported in large part by low long-term interest rates and the Fed’s aggressive easing of monetary policy. Even after the recession ended, the federal funds rate remained at 1% for over 12 months during 2003 and 2004. The housing market became a powerful source of stimulus for the U.S. economy. Low mortgage interest rates set off a refinancing boom, allowing consumers to tap the equity in their homes to pay for goods and services. Hundreds of thousands of jobs were created in construction, mortgage banking, and real estate. In various ways, stimulus from the early stages of the housing bubble helped to mitigate, or perhaps simply postpone, the economic fallout from the burst stock market bubble.
Figure 2
Real household net worth per person

Note: Indexed to 100 at business cycle peak.
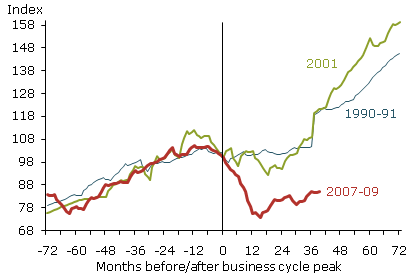
Figure 2 shows that the decline in household net worth per person was more pronounced in the Great Recession than in the two previous recessions, as both stocks and housing experienced severe bear markets. This decline in net worth helps explain the drop in consumption and the increase in personal saving since 2007 (see Glick and Lansing 2011). Other factors include an increase in precautionary saving and, importantly, the curtailment of unsound lending practices that had helped fuel the prior debt-financed spending boom.
Quantifying the amount of foregone consumption
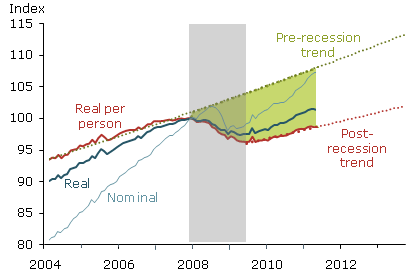
Figure 3 compares trajectories for nominal, real, and real per-person consumption expenditures during the Great Recession. Nominal consumption expenditures continued to trend upwards for eight months after the recession started because spiking fuel prices inflated the nominal value of many transactions. In contrast, real consumption expenditures started trending down immediately, but have since recovered to levels exceeding their pre-recession peak. Real consumption per person has recovered more slowly because the U.S. population has grown just under 1% per year.
Figure 3
Personal consumption expenditures

Note: Indexed to 100 at business cycle peak, seasonally adjusted.
Figure 3 plots an exponential growth trend for real consumption per person from January 2000 to December 2007. The trend line is carried forward to produce an alternate trajectory for real consumption per person if the recession had not occurred. The space between the extrapolated trend and the actual trajectory measures foregone consumption per person, yielding a figure of $7,356 per person in 2005 dollars over 42 months. This averages a spending loss of $175 per person per month.
Economic theory assumes that consumption is a key determinant of personal well-being. Many households became accustomed to the consumption trend established before the recession and expected it to continue. From that perspective, the amount of foregone consumption might be viewed as a measure of the recession’s cost for the average person. However, the pre-recession consumption trend was almost surely not sustainable because much of the household debt that helped finance that spending was collateralized by bubble-inflated housing values. Consumption was bound to slow sooner or later. Indeed, the average annual compound growth rate of real consumption per person since the recession ended in June 2009 is 1.15%, well below the 2% rate before the recession.
Moreover, it is unclear whether continuing the pre-recession consumption trend was economically desirable. Many households might have continued saving too little for retirement while becoming more burdened with debt. When the housing bubble was expanding, former Fed Chairman Paul Volcker (2005) noted several “disturbing trends,” including that “personal savings in the United States have practically disappeared,” and that “home ownership has become a vehicle for borrowing.” He called for federal policies to “forcibly increase” the saving rate as a way to address the growing imbalance between domestic spending and production.
Other economic impacts
Figure 4
Employment to population ratio (seasonally adjusted)

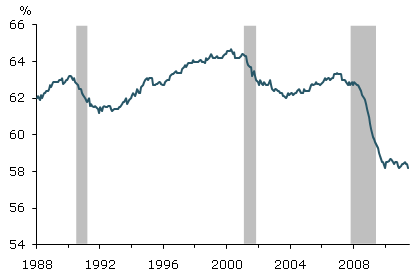
Of course, fallout from the Great Recession extends beyond lost consumption. The downturn profoundly damaged the labor market. Nonfarm payroll employment declined by about 8.5 million jobs from peak to trough. The unemployment rate increased from 4.7% in November 2007 to a peak of 10.1% in October 2009. Two years after the end of the recession, the unemployment rate is still above 9% and, as Figure 4 shows, the employment-to-population ratio hasn’t recovered at all. The average duration of unemployment remains near historic highs, which raises the risk that unemployed people’s job skills will deteriorate.
Other impacts of the Great Recession include spillovers on neighborhoods from foreclosures and empty houses, reduced geographic mobility of homeowners with underwater mortgages, lost state and local tax revenues that have led to cutbacks in public services, and the burden imposed on future generations of repaying trillions of dollars in federal debt issued to finance programs aimed at combating the crisis.
Policy implications
The extensive harm caused by the Great Recession raises the question of whether policymakers could have done more to avoid the crisis. Specifically, should central banks take steps to prevent or deflate asset price bubbles (see Lansing 2008, 2003b). The mainstream view prior to the crisis was that central banks should not attempt to prick a suspected bubble. Instead, according to former Fed Chairman Alan Greenspan (2004), they should follow a “strategy of addressing the bubble’s consequences rather than the bubble itself.” This view is predicated on the idea that it is difficult for policymakers to identify a bubble in real time.
However, central banks regularly respond to economic variables that are difficult to measure in real time, such as the “output gap,” defined as the difference between actual and potential GDP. Moreover, some economists argue that bubbles can be identified in real time if central banks look beyond asset prices to other variables that historically have signaled threats to financial stability, such as sustained rapid credit expansion. According to Borio and Lowe (2002), when faced with a suspected bubble, bubble-popping skeptics fail to sufficiently account for the asymmetric nature of the costs of policy errors: “If the economy is indeed robust and the boom is sustainable, actions by the authorities to restrain the boom are unlikely to derail it altogether. By contrast, failure to act could have much more damaging consequences.”
More recently, the U.S. Financial Crisis Inquiry Commission (2011) concluded, “Despite the expressed view of many on Wall Street and in Washington that the crisis could not have been foreseen or avoided, there were warning signs. The tragedy was that they were ignored or discounted.” The commission lists such red flags as “an explosion in risky subprime lending and securitization, an unsustainable rise in housing prices, widespread reports of egregious and predatory lending practices, (and) dramatic increases in household mortgage debt.”
In light of the severe economic fallout from the Great Recession, policymakers’ views regarding bubbles may be shifting. In an interview during the crisis (Wall Street Journal 2008), Fed Chairman Ben Bernanke said, “[O]bviously the last decade has shown that bursting bubbles can be an extraordinarily dangerous and costly phenomenon for the economy and there is no doubt that as we emerge from the financial crisis, we will all be looking at that issue and what can be done about it.”
Using monetary policy to lean against bubbles may not represent such a radical departure from conventional wisdom. In 2002, Bernanke emphasized that central banks should take steps to prevent deflation. In particular, he asserted, “Sustained deflation can be highly destructive to a modern economy and should be strongly resisted.… (P)revention of deflation is preferable to cure.” The two best-known examples of deflation—the U.S. Great Depression of the 1930s and Japan’s lost decades of the 1990s and 2000s—occurred after asset bubbles burst. If a bursting bubble can set the stage for deflation, which in turn would be “highly destructive” to the economy, then the case for preemptive action against bubbles may be strong indeed.
Another question concerns the policy instruments that central banks might use to counter bubbles. A broad view of monetary policy includes regulatory oversight of financial institutions. Many have argued that a central bank’s interest rate policy is too blunt an instrument and that regulatory policy is better suited to restraining bubbles. However, regulatory policy may not be a magic bullet. Unfortunately, regulations put in place after a crisis to prevent bubbles are often relaxed as complacency sets in, opening the way for the next bubble (see Gerding 2006). Interest rate policy may have a distinct advantage because vigilant central bankers can deploy it against bubbles regardless of the regulatory environment.
References
Bernanke, Ben S. 2002. “Deflation: Making Sure ‘It’ Doesn’t Happen Here.” Remarks before the National Economists Club, Washington, DC (November 21).
Borio, Claudio, and Philip. Lowe. 2002. “Asset Prices, Financial and Monetary Stability: Exploring the Nexus.” Bank for International Settlements Working Paper 114.
Gerding, Erik F. 2006. “The Next Epidemic: Bubbles and the Growth and Decay of Securities Regulation.” Connecticut Law Review 38(3), pp. 393–453.
Glick, Reuven, and Kevin J. Lansing. 2009. “U.S. Household Deleveraging and Future Consumption Growth.” FRBSF Economic Letter 2009-16 (May 15).
Glick, Reuven, and Kevin J. Lansing. 2011. “Consumers and the Economy, Part I: Household Credit and Personal Saving.” FRBSF Economic Letter 2011-01 (January 10).
Greenspan, Alan. 2004. “Risk and Uncertainty in Monetary Policy.” American Economic Review Papers and Proceedings 94(2), pp. 33–40.
Lansing, Kevin J. 2003a. “Growth in the Post-Bubble Economy.” FRBSF Economic Letter 2003-17 (June 20).
Lansing, Kevin J. 2003b. “Should the Fed React to the Stock Market?” FRBSF Economic Letter 2003-34 (November 14).
Lansing, K.J. 2005. “Spendthrift Nation.” FRBSF Economic Letter 2005-30 (November 10).
Lansing, Kevin J. 2008. “Monetary Policy and Asset Prices.” FRBSF Economic Letter 2008-34 (October 31).
U.S. Financial Crisis Inquiry Commission. 2011. “Final Report of the National Commission on the Causes of the Financial and Economic Crisis in the United States” (January).
Volcker, Paul A. 2005. “An Economy on Thin Ice.” Washington Post, April 10, p. B07.
Wall Street Journal. 2008. “Fed Chairman’s Q&A on Financial Crisis” (October 16).
Walsh, Carl E. 1993. “What Caused the 1990–1991 Recession?” FRBSF Economic Review 93-2, pp. 34–48.
Opinions expressed in FRBSF Economic Letter do not necessarily reflect the views of the management of the Federal Reserve Bank of San Francisco or of the Board of Governors of the Federal Reserve System. This publication is edited by Anita Todd and Karen Barnes. Permission to reprint portions of articles or whole articles must be obtained in writing. Please send editorial comments and requests for reprint permission to research.library@sf.frb.org