Many analysts have predicted that a Chinese economic slowdown is inevitable because the country is approaching the per capita income at which growth in other countries began to decelerate. However, China may escape such a slowdown because of its uneven development. An analysis based on episodes of rapid expansion in four other Asian countries suggests that growth in China’s more developed provinces may slow to 5.5% by the close of the decade. But growth in the country’s less-developed provinces is expected to run at a robust 7.5% pace.
After a prolonged period of extremely rapid economic growth, is China slowing down? China’s gross domestic product is expected to decelerate to 8% growth this year from 9.2% in 2011, according to the International Monetary Fund (see International Monetary Fund 2012). China’s slowdown is often attributed to transitory events beyond its control, such as the crisis in Europe and the sluggishness of the U.S. recovery. Moreover, despite the downshift, growth is broadly in line with the Chinese government’s five-year plan and remains at a pace many countries would welcome.
Nonetheless, some analysts warn that the slowdown may be permanent. Historically, countries don’t seem to be able to grow at such rapid rates forever. Fast-growing countries often fall into what is commonly referred to as the “middle-income trap,” in which rising wages erode global competitiveness, leading to a marked slowdown. Eichengreen, Park, and Shin (2011) demonstrate that growth rates of fast-expanding countries decline on average around 2% per year when per capita income reaches about $17,000. China will soon approach that level. Moreover, studies of sustained rapid growth episodes suggest that, on average, they do not exceed ten years (see Aizenman and Spiegel 2010). China has grown rapidly for over 30 years. Given China’s prominence in the global economy, a prolonged slowdown could weigh on Western economies and hamper a global recovery already under pressure from the euro-area downturn and weak U.S. expansion.
This Economic Letter examines whether a substantial Chinese slowdown is imminent. We pay special attention to the fact that per capita income in China is extremely unequal. China ranks 27th out of 136 countries in income inequality (Central Intelligence Agency 2012). Moreover, income distribution is highly skewed geographically. Wealthier provinces are mainly located on the eastern coast, while poorer provinces are concentrated in the largely rural interior. Some provinces, most notably Beijing and Shanghai, are close to, or even beyond, the $17,000 per capita income level associated with the middle-income trap. But many Chinese provinces have far to go before reaching this level (see Eichengreen et al. 2011). If growth in these provinces outpaces that in the wealthier regions, China’s economy could continue to grow at a robust pace for a long time.
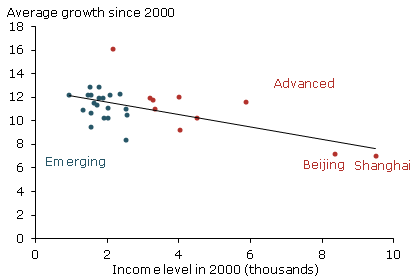
Figure 1
Convergence among Chinese provinces

Source: CEIC database.
Recent evidence suggests that the poorer Chinese provinces are catching up with their richer counterparts, at least on average. This phenomenon, called convergence, has been observed widely in other countries, including the United States, where poorer states have tended to grow income faster than richer states (see Barro and Sala-i-Martin 1992).
Figure 1 displays average growth rates for Chinese provinces since 2000. There is a negative relationship between a province’s income in 2000 and its subsequent growth. China’s two wealthiest provinces, Beijing and Shanghai, have had the lowest per capita growth since 2000.
We divide China’s provinces into higher and lower-income groups, examining their prospects for continued growth based on current income levels. Provinces with per capita income below $10,000 are identified in blue as emerging. Provinces above that level are identified in red as developed. We then perform a statistical exercise, using data from a group of other Asian economies that have had rapid growth experiences to predict expansion rates for these two groups of Chinese provinces.
Our results indicate that growth of the wealthier portion of China is likely to slow, but substantial room remains for continued growth in China’s interior. For example, among the advanced Chinese provinces, average growth is predicted to slow to 7% in the five years beginning in 2016. However, growth among China’s emerging provinces is not expected to fall to that rate until sometime during the five years beginning in 2024. Thus, the emerging Chinese provinces are predicted to enjoy more than an additional decade of high growth before succumbing to the middle-income trap.
Middle-income traps in other Asian countries
What evidence exists for middle-income traps in a group of Asian economies that, like China, experienced episodes of rapid growth? We pool data for Hong Kong, Japan, Korea, and Taiwan from 1950 to 2009. Data are measured in five-year intervals to concentrate on long-term growth patterns and avoid the volatility that stems from short-term business cycle effects. GDP per capita is measured in international 2005 dollars using the Heston, Summers, and Aten (2012) Penn World Table 7.1.
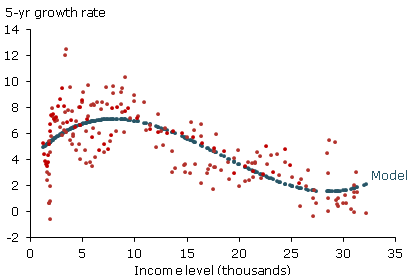
Figure 2
GDP growth vs. income for four Asian economies

Source: Penn World Tables. Annual data from Hong Kong, Japan, Korea, and Taiwan.
Figure 2 displays a scatterplot of the relationship between per capita income and average growth over the following five years for the four economies. It shows that growth of these economies slowed markedly after they reached middle-income status.
Growth rates for these economies are highest just below the $10,000 per-capita-income level and then slow down rapidly as income increases. The blue curve indicates that these economies grew on average at a 4.8% rate when per capita income reached $17,000, down from a high of 7.2% at the $7,800 level.
Interestingly, the middle-income trap appears to arise in Asia at lower income levels than has been found for broader groups of emerging-market economies. It may be that large Asian countries with relatively low prevailing wages cause the dynamic of the middle-income trap to shift. In Asia, countries may begin to become uncompetitive for certain labor-intensive activities at lower income levels than in other parts of the world.
Implications for Chinese growth
What does the middle-income slowdown experienced by the four Asian economies imply for China? Using the results from our pooled sample of four Asian economies, we create a model to predict five-year-interval growth rates for our emerging and developed Chinese provinces. Technically, we use what is known as an error-correction model in which the movement of the variables in any period is related to the previous period’s departure from the long-term trend. In this case, current income growth in the model depends on the gap between income growth during the past five-year period and the growth predicted by the curve in Figure 2. We then estimate the rate at which the gap narrows between observed growth and the model’s forecast growth rate. Our model implies that growth is self-correcting, in that the gap between the observed growth rate and the statistically predicted rate for the four Asian economies decreases at a steady pace. We apply our model to China to predict growth rates for the emerging and advanced Chinese regions. (For details on the specifications and methodology used, please see /wp-content/uploads/sites/4/el2012-31-technical-appendix.pdf).
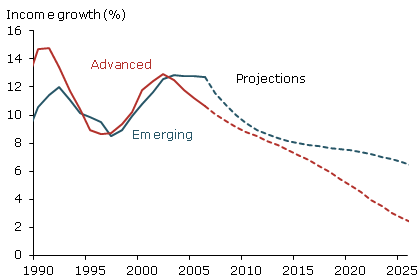
Figure 3
Growth forecasts: Advanced vs. emerging economies

Sources: CEIC database, Penn World Tables.
Figure 3 shows observed and forecast growth for the two Chinese regions since 1990. Our statistical exercise forecasts a slowdown in both regions, but the pace is quite different. In the developed provinces, the slowdown is relatively rapid, though not abrupt. Expected growth in these provinces falls to 7% in the five-year interval beginning in 2016.
However, the expected pace of slowdown in the emerging provinces is even less. Expected growth in these provinces doesn’t fall to 7% until sometime during the five-year interval beginning in 2024. The reason for this discrepancy is that the emerging provinces have a long way to go before they reach income levels associated with the middle-income trap.
This implies that, in the near future, rapid growth in China will be concentrated primarily in the Chinese interior rather than in the more advanced areas near the coast. For example, by 2020, growth in the developed provinces is expected to slow to a still-healthy, but unexceptional 5.5%. But growth in the emerging provinces is expected to remain a robust 7.5%. Thus, China’s overall growth slowdown may not be severe. The advanced provinces may indeed reach income levels associated with the middle-income trap. But rapid expansion in the emerging provinces will at least partly offset the overall effect on China’s growth.
Caveats
Our analysis is based on a simple statistical model. Actual growth may not mirror the model’s forecasts for several reasons. Much recent Chinese growth has been in the manufacturing, export-oriented industries located primarily in the developed coastal provinces. While growth in the Chinese interior is currently consistent with convergence, that pattern is the historical exception. Except for a few years in the late 1990s, growth in the advanced provinces has consistently exceeded that in the emerging provinces. The inland regions face a number of challenges, including inferior infrastructure and remoteness from industrial networks. Such obstacles could keep them from converging with the more affluent provinces at rates comparable to those observed elsewhere in Asia.
On the other hand, the Chinese government is now pursuing policies explicitly designed to address income inequality (see Lin 2012). These policies promote the convergence of emerging provinces at a more rapid rate than that predicted by our statistical model. The disadvantages and advantages of the emerging provinces tend to offset each other and it is hard to know which will be dominant. Moreover, dividing China into emerging and advanced regions is to some extent artificial. In reality, they are part of the same country and affect each other in important ways that bear on their respective growth rates. Capital from the wealthier provinces might flow to the emerging provinces, which may seem to have more profitable investment opportunities, spurring growth.
Conclusion
While average income in China appears to be headed towards levels that have been associated with growth slowdowns in other countries, high income inequality between wealthier coastal provinces and the less-developed interior suggest that deceleration may not be severe. China’s relatively undeveloped areas may be able to grow at high rates for some time before reaching income levels associated with slowdown. This could delay a middle-income trap growth slowdown for the nation as a whole. Emerging Chinese provinces are likely to maintain their high growth rates for some time after their wealthier counterparts have slowed. Still, many other developments could influence the relative pace of growth in different regions of China, including government expenditure on infrastructure in the outlying regions, the pursuit of policies designed to reduce income inequality, and the impact of continued labor migration from emerging provinces. Substantial uncertainty remains about the relative pace of growth in the emerging and advanced Chinese provinces.
References
Aizenman, Joshua, and Mark M. Spiegel. 2010. “Takeoffs.” Review of Development Economics 14(2), pp. 177–196.
Barro, Robert J., and Xavier Sala-i-Martin. 1992. “Convergence.” Journal of Political Economy 100(2), pp. 223–251.
Central Intelligence Agency. 2012. “Gini Index.” The World Factbook.
Eichengreen, Barry, Donghyun Park, and Kwanho Shin. 2011. “When Fast Growing Economies Slow Down: International Evidence and Implications for China.” NBER Working Paper 16919.
Heston, Alan, Robert Summers, and Bettina Aten. 2012. “Penn World Table Version 7.1.” Center for International Comparisons of Production, Income and Prices at the University of Pennsylvania, July.
Lin, Justin Yifu. 2012. “China and the Global Economy.” In Asia’s Role in the Post-Crisis Global Economy, eds. Reuven Glick and Mark M. Spiegel, 2011 Asia Economic Policy Conference Proceedings. San Francisco: Federal Reserve Bank of San Francisco, pp. 213–229.
International Monetary Fund. 2012. “World Economic Outlook Update.” July 16.
Opinions expressed in FRBSF Economic Letter do not necessarily reflect the views of the management of the Federal Reserve Bank of San Francisco or of the Board of Governors of the Federal Reserve System. This publication is edited by Anita Todd and Karen Barnes. Permission to reprint portions of articles or whole articles must be obtained in writing. Please send editorial comments and requests for reprint permission to research.library@sf.frb.org