
The impact of the global financial crisis on labor markets varied widely from country to country. In the United States, the unemployment rate nearly doubled from its pre-recession level. The rate rose much less in the United Kingdom and barely changed in Germany, despite larger declines in gross domestic product. Institutional and technological changes since the 1970s had previously made relationships between output and unemployment more homogeneous across countries. But the global financial crisis undid much of this convergence as countries adopted different labor market policies to adjust output.
Arthur Okun (1962) observed half a century ago that changes in unemployment have a consistent and predictable relationship with changes in real gross domestic product (GDP). Since then, what is now called “Okun’s law” has become a core principle in macroeconomics and a standard tool used by monetary policymakers and economic forecasters (see, for example, Bernanke 2012).
Research has found that the exact value of the Okun’s law relationship varies markedly across countries (Gordon 2011). For example, at the lower end, in the United States and Canada, a 2 percentage point increase in output is associated with about a 1 percentage point decrease in the unemployment rate. At the upper end, for some European countries, this relationship is as high as 5-to-1. These interactions, which we call the Okun correlation, provide a convenient summary measure of the institutional and industrial relations that underlie the correlation between output and unemployment.
That unemployment goes down when output goes up and vice versa is hardly surprising. Other things equal, producing more goods requires more workers. However, the apparent stability of this relationship is remarkable, suggesting that subtle mechanisms determine how businesses adjust to shocks that change demand for their products. We focus on three levers businesses might use: the number of workers they employ, the number of hours each employee works, and their rate of productivity.
When demand declines, businesses can lay off workers, especially if the drop in demand is viewed as permanent. They can adjust the hours each employee works. Or they can adjust the average output they get from each worker they employ, that is, the productivity of their workforce. The mix of adjustments a business chooses depends on a range of factors. These include labor laws and contracts that affect an employer’s ability to lay off workers or change hours. It also includes competitive pressures that create incentives to raise productivity and lower production costs. Of course, productivity might also fall if output declines and a business cannot or chooses not to reduce hours fully. Depending on how a business adapts to a drop in demand, the Okun correlation will vary.
Advanced economies looking more alike
Since the 1970s, several broad developments have changed the relationship between unemployment and output. From the mid-1980s to the mid-2000s, economies across the world experienced a simultaneous decline in the volatility of output and a reduction in inflation, a period known as the Great Moderation. Female labor force participation in advanced economies had surged since the 1960s, but began to stabilize in the mid-1990s and then decline. Meanwhile, in the past 10 years, aging populations in advanced economies have driven broader declines in overall participation. Finally, labor markets have become more flexible and the power of unions has waned. All of these developments have affected the Okun correlation.
Figure 1
Cross-country evolution of Okun correlation
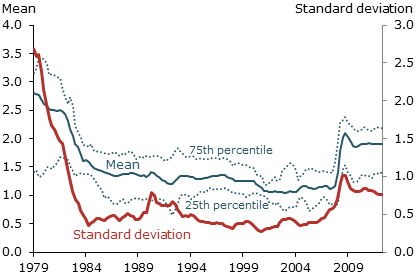
Figure 1 shows the evolution of the Okun correlation across advanced economies. It uses quarterly data since 1970 for 15 members of the Organisation for Economic Co-operation and Development (OECD): Australia, Austria, Belgium, Canada, Denmark, Finland, France, Italy, Germany, Netherlands, New Zealand, Norway, Sweden, United Kingdom, and the United States. For each country, we estimate the relationship between year-over-year changes in output and unemployment over a 10-year period for every quarter from 1979 to 2012.
Statistical analysis shows how many percentage points output tends to fall below its average growth rate when unemployment rises 1 percentage point. The figure displays the average value and the standard deviation of this relationship across the 15 countries for each quarter. Standard deviation is a common statistical calculation that measures the range of variation, otherwise known as dispersion, in a data series. Figure 1 also depicts the dispersion of the Okun correlation across countries by plotting the estimated relationship for the bottom and top quarter of countries in the sample, denoted 25th and 75th percentile, respectively.
Before the Great Moderation, the Okun correlation in the typical country was large. A 1 percentage point increase in the unemployment rate was associated with nearly a 3 percentage point shortfall in output growth. But within that average value, countries differed greatly. For some the relationship was as small as 1-to-1. During the 1990s and early 2000s, the average Okun correlation gradually declined to nearly 1-to-1 at its lowest point and differences across countries narrowed considerably.
Then came the global financial crisis. Data since 2007 indicate that the Okun correlation rose to levels last seen in the 1980s. This apparently stems from the fact that countries adopted different policies during and after the crisis, reflecting institutional or philosophical differences. As output fell, some of these policies prevented unemployment from rising as sharply as it typically did before the crisis. The different approaches countries took increased the dispersion in the Okun correlation, although this was a different process from the one that drove the secular decline before 2007.
The Great Recession: The Great Divergence?
Several factors probably explain the decline in the Okun correlation before 2007, including globalization, greater labor mobility, and overall liberalization of employee-employer relations. In addition, over the past decade, employment protection has declined, a feature visible in regulatory changes concerning individual and collective job dismissals (see, for example, OECD 2013). These factors have generally increased labor and product market flexibility. As a result, when output changed, more of the adjustment took place through employment, which in turn showed up in the unemployment rate.
The global financial crisis both raised the 15-country Okun correlation and increased its cross-country variability. Did these changes reflect a reversal of the factors behind the pre-2007 declines? To better understand what happened following the global financial crisis, we break down the Okun relationship into three parts: changes in output associated with movements in total employment, in hours per worker, and in labor productivity. In particular, decomposing the Okun correlation into these three factors clarifies the differences in how the United States, Great Britain, and Germany emerged from the crisis.
Figures 2, 3, and 4 show the response of each of the three factors to increasing unemployment in 15 OECD countries. The figures distinguish two samples: one before the crisis from the first quarter of 1996 to the fourth quarter of 2006 and a second during and after the crisis from the first quarter of 2007 to the first quarter of 2013. One takeaway is that the Okun correlation is mostly a result of the total employment component. Hours per worker and productivity contribute to the correlation, but are less important.
Figure 2
Response to rising unemployment: Total employment
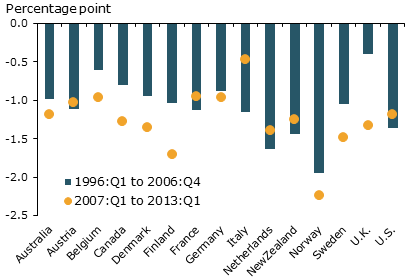
Figure 3
Response to rising unemployment: Hours per worker
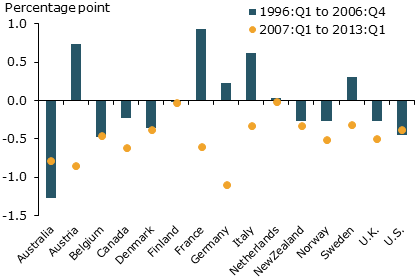
Figure 4
Response to rising unemployment: Productivity
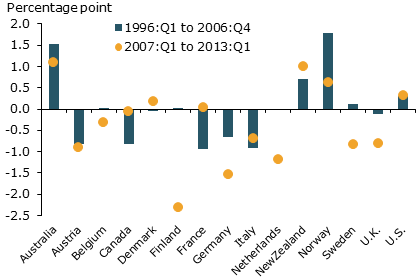
Figure 2 shows that in both the pre-crisis and later periods, a 1 percentage point increase in unemployment is typically associated with a decline of about a percentage point or more in a country’s employment rate. Such a relationship is intuitively obvious, but variations in such factors as labor force participation and immigration mean that the association is not necessarily 1-to-1.
The relationship between hours per worker and unemployment varies more across countries (Figure 3). In some countries this relationship is positive, suggesting that the remaining workforce is used more intensively in a downturn. In other countries, the relationship is negative, suggesting less intensive use of the workforce. Finally, the relationship between productivity and unemployment also varies considerably across countries (Figure 4). For example, it is positive in the United States, but negative in France. Increases in unemployment are associated with rising productivity in the United States and falling productivity in France.
During and since the Great Recession, countries have adjusted all three factors, but have placed different emphasis on them. The U.S. adjustment was largely in line with its pre-recession experience of reduced employment, falling work hours, and increased productivity. By contrast, in the United Kingdom, the declines in employment, hours, and productivity were larger than in the pre-recession period. Compared with the United States, the main difference was that Britain adjusted productivity far more. In Germany, the pre-and-post-crisis responses were notable. Both hours per worker and productivity fell much more following the crisis, explaining why Germany saw big output changes during the crisis and recovery period with relatively little change in the unemployment rate. This partly reflects Germany’s widespread adoption of procedures that permitted employers to adjust worker hours easily (Burda and Hunt 2011).
Germany, the United Kingdom, and the United States are good examples of three ways businesses in advanced economies responded to the global financial crisis. In Germany, the pattern reflects explicit policy decisions. In other countries, the reasons for the differences are less clear. In all cases, the differences among countries in the methods businesses used to adjust output are directly reflected in the path of each country’s unemployment rate.
Conclusion
The global financial crisis reversed the steady cross-country convergence of the Okun relationship observed since the 1970s. This is not explained by a reversal of secular trends in labor markets. Rather, it reflects how countries responded to the crisis. Differences in the institutional framework in possible combination with government policy responses to the crisis led some countries to emphasize shrinking the workforce, others to reducing hours per worker, and still others to letting labor productivity adjust. These differences in emphasis probably contributed to divergent paths of recovery from the crisis. The crisis led to a reevaluation of the regulation of financial markets. Similarly, the events of recent years should lead to a consideration of how labor market institutions can be improved.
Mary C. Daly is a senior vice president and associate director of research in the Economic Research Department of the Federal Reserve Bank of San Francisco.
John Fernald is a senior research advisor in the Economic Research Department of the Federal Reserve Bank of San Francisco.
Òscar Jordà is a research advisor in the Economic Research Department of the Federal Reserve Bank of San Francisco.
Fernanda Nechio is an economist in the Economic Research Department of the Federal Reserve Bank of San Francisco.
References
Bernanke, Ben S. 2012. “Recent Developments in the Labor Market.” Speech at the National Association for Business Economics Annual Conference, Washington, DC, March 26.
Burda, Michael, and Jennifer Hunt. 2011. “What Explains the German Labor Market Miracle in the Great Recession?” Brookings Papers on Economic Activity (Spring), pp. 273–319.
Gordon, Robert J. 2011. “The Evolution of Okun’s Law and of Cyclical Productivity Fluctuations in the United States and in the EU-15.” Presented at EES/IAB workshop, Labor Market Institutions and the Macroeconomic, Nuremberg, June 17–18.
Okun, Arthur M. 1962. “Potential GNP: Its Measurement and Significance.” Proceedings of the Business and Economics Statistics Section of the American Statistical Association, pp. 98–104.
OECD. 2013. “Protecting Jobs, Enhancing Flexibility: A New Look at Employment Protection Legislation.” In OECD Employment Outlook 2013. Paris: OECD Publishing.
Opinions expressed in FRBSF Economic Letter do not necessarily reflect the views of the management of the Federal Reserve Bank of San Francisco or of the Board of Governors of the Federal Reserve System. This publication is edited by Anita Todd and Karen Barnes. Permission to reprint portions of articles or whole articles must be obtained in writing. Please send editorial comments and requests for reprint permission to research.library@sf.frb.org