
Social Security Disability Insurance is projected to be insolvent before the end of the decade. How best to restore the program to long-term financial health depends on what has been driving its rapid growth. Demographic shifts and other predictable factors explain part of the increase. But a sizable share reflects increasing participation in the program across population groups. Curbing this growth is important for putting the program back on a sustainable fiscal path.
Social Security Disability Insurance (DI) is a federal benefits program for working-age adults. The number of workers receiving DI increased from 2.9 million in 1980 to 8.8 million in 2012. Population growth explains part of this increase. But DI caseloads as a share of the population age 20 to 64—known as the disability recipiency rate—also have risen rapidly over the past several decades. The Social Security Board of Trustees projects that, absent policy action, DI will be insolvent by 2016. The Congressional Budget Office (CBO 2013) projects a slightly later insolvency date of 2017.
What are the factors that have driven DI growth? And will those factors stay in place or wane? These questions expose sharp disagreements among academics, Social Security actuaries, and disability policy advocates.
Social Security’s Office of the Chief Actuary argues that most of the increase reflects predictable and transitory factors, including an aging population, a growing share of working women eligible for DI, and the increase in Social Security’s full retirement age (see Goss 2013 and Ruffing 2012). The actuaries expect caseload growth to level off as the effects of these factors diminish. Under this scenario, one-time adjustments to revenues or benefits could restore DI’s long-term solvency (see CBO 2012 for a description of possible adjustments to the program).
Other analysts argue that changes in policy and the way DI operates have also driven up caseloads. These changes include more generous benefits, increased access to the program, and the behavior of DI administrators and applicants themselves (Autor and Duggan 2003; Duggan and Imberman 2009; Burkhauser and Daly 2011, 2012; and Rupp and Stapleton 1995). These analysts contend that DI is likely to keep expanding unless program rules and incentives are fundamentally altered.
Drivers of program growth
Between 1980 and 2011, the number of DI recipients rose almost threefold. Over the same period, the disability recipiency rate, that is, caseloads as a share of the working-age population, grew from 2.3% to 4.7%. In other words, DI caseloads increased about twice as quickly as the working-age population.
Figure 1 shows estimates of how three factors external to the DI program contributed to the rise in the recipiency rate:
- the increase in Social Security’s full retirement age;
- the aging of the population;
- the rising percentage of women in the labor force.
Figure 1
Sources of DI recipiency growth, 1980-2011
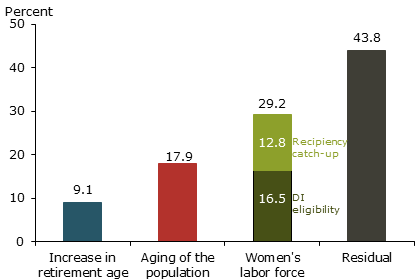
Source: Authors’ calculations based on Social Security Administration (2012) and Bureau of Labor Statistics.
Part of the recipiency rate increase reflects the rise in the full Social Security retirement age from 65 to 66, which was phased in beginning in 2003. This change may have induced some older workers in poor health to use the DI program as a bridge to the full retirement age. A simple way to account for this is to attribute the increase in the disability recipiency of 65-year-olds since 2003 to the full retirement age change. Although this ignores any effects the new full retirement age might have on workers younger than 65, it is a reasonable approximation of the direct effect of the increase. This exercise finds that the full retirement age change accounts for about 9% of recipiency growth since 1980.
Disability is more prevalent among older people, so an aging population also has boosted recipiency. We estimate how much the overall DI recipiency rate would have increased if only the age distribution of the working-age population had changed. We hold recipiency rates for gender and age groups constant at their 1980 values and let caseloads change as the population share of each gender and age group shifts (see Technical Appendix, for details on this and other calculations). This generates our estimate that an aging population accounts for about 18% of the 1980–2011 recipiency increase, which is consistent with findings of other researchers (for example, Duggan and Imberman 2009).
A final factor pushing up the rolls is the rising percentage of women in the labor force and their increased eligibility for DI. To be eligible, applicants must have had significant past work experience. As women have become more attached to the labor force, their eligibility for DI has risen. To estimate this impact, we apply the same method used to quantify the impact of an aging population, holding the recipiency rate for women constant at the 1980 level and letting caseloads evolve with women’s rising eligibility. We find that women’s increased eligibility accounts for about 16% of the 1980–2011 disability recipiency increase, also consistent with other research.
Notably, in 1980, women’s DI recipiency rate was well below that of men, even after accounting for the lower eligibility of women. Analysts don’t agree on what explains this gap. Some argue it reflects underlying health differences between men and women. Others maintain that women eligible for DI were not representative of the entire population of women in 1980 and that a representative sample of women would have had a recipiency rate similar to men’s.
Our initial calculation ignored the 1980 recipiency gender gap and looked only at the effect of women’s increased eligibility on the DI recipiency rate. We next imagine that some of the rise in the overall DI recipiency rate also reflects women’s recipiency catching up to a rate consistent with the underlying health of women. We quantify this assumption by setting the recipiency rate for women equal to that for men in 1980. As Figure 1 shows, this adds another 13% to our estimates of how much the greater eligibility of women has contributed to the rising recipiency rate. Taken together, we estimate that women’s increased eligibility and their rising recipiency rate account for 29% of DI recipiency growth since 1980.
Overall, we find that factors outside of the DI program account for 43% to 56% of the DI recipiency rise since 1980, depending on how much we assume women’s recipiency catches up to men’s. Our finding that these factors explain roughly 40% to 60% of recipiency growth over the past three decades is consistent with previous analyses (see, for example, Duggan and Imberman 2009 and Goss 2013).
Explaining the remaining growth
Figure 2
Scenarios of future DI growth
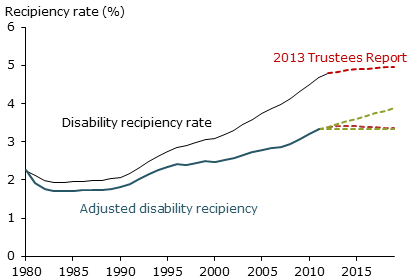
Source: Authors’ calculations based on data from the Bureau of Labor Statistics, U.S. Census Bureau, Social Security Administration (2012), Stephens and Thomas (2011), and Board of Trustees of OASDI (2013).
Note: The lower red line is an adjusted recipiency rate based on the detailed age-gender projections estimated by Stephens and Thomas (2011). Those projections are scaled using the ratio of projected caseloads in Board of Trustees of OASDI (2013) to projected caseloads as reported in Stephens and Thomas (2011).
Our analysis finds that a significant fraction of growth in the DI rolls since 1980 remains unexplained. Two possible explanations are changes in the operation of the program and the value of benefits, according to analysts. In 1984, Congress expanded the ways workers could qualify for DI benefits. The program’s eligibility criteria shifted from a list of specific impairments to a more general consideration of a person’s ability to work and medical condition, including pain and other symptoms. Consequently, the proportion of beneficiaries approved based on more subjective vocational or functional criteria grew from 24.6% in 1984 to 54.3% in 2010 (Social Security Advisory Board 2012).
Additionally, over the past 20 years, the relative value of cash benefits has risen for low-wage workers. Autor and Duggan (2003) show that the combination of rising income inequality and the indexation of benefits by the average wage level increased the extent to which DI payments replaced wages for low-paid workers. The rising replacement rate has made DI benefits more attractive for low-wage workers and has probably amplified DI’s sensitivity to the business cycle.
Social Security’s Office of the Chief Actuary offers a third potential factor. Part of residual growth since the 1980s comes from one-time jumps in disability incidence rates among young workers and women (see Goss 2013).
Projections of future DI growth
Figure 3
Social Security projections of DI receipt
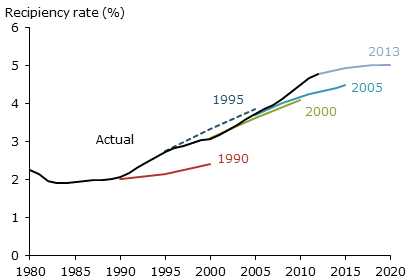
Source: Authors’ calculations based on Board of Trustees of OASDI (various years), Bureau of Labor Statistics, and U.S. Census Bureau.
Figure 2 plots the historical disability recipiency rate, the rate adjusted for transitory factors noted above, and the Social Security Administration’s projections of future caseload growth, shown by the red dotted lines. We estimate Social Security’s projection of the adjusted rate using detailed age-gender projections estimated by Stephens and Thomas (2011) and the most recent caseload projections as shown in Board of Trustees of OASDI (2013). The figure also shows our estimate of the uncertainty around Social Security’s projections, based on historical adjusted caseload growth, shown by the dashed green lines. The higher green line shows how the adjusted recipiency rate would evolve if it continued to increase at its average pace from 1990 to 2010. We choose those years to exclude the effects of significant policy changes in the 1980s. The lower green line represents the scenario in which recipiency adjusted for age and gender peaks in 2011, the last year for which we have the necessary data, and then flattens. In both cases, we assume population ages according to Census Bureau projections.
Based on our calculations, the Social Security Administration’s most recent adjusted disability recipiency forecast is at the bottom of our range of projections. This suggests there is some risk that Social Security’s most recent projections underestimate future growth. Figure 3 plots the Social Security Administration’s 10-year estimates of DI growth at various points over the past 20 years. It shows that SSA has mostly underestimated recipiency growth.
Conclusion
Our breakdown of DI caseload growth over the past three decades indicates that between 43% and 56% of it can be attributed to one-time factors that have largely run their course and are unlikely to put pressure on SSDI caseloads in the future. This leaves a significant residual fraction between 44% and 57% that is unaccounted for. This portion of DI growth could increase rapidly and push recipiency well beyond SSA’s projections. Thus, understanding these unexplained factors behind DI’s caseload growth is vital for policymakers seeking solutions to the DI program’s impending insolvency.
Mary C. Daly is a group vice president and associate director of research in the Economic Research Department of the Federal Reserve Bank of San Francisco.
Brian Lucking is a research associate in the Economic Research Department of the Federal Reserve Bank of San Francisco.
Jonathan A. Schwabish is a principal analyst at the Congressional Budget Office.
References
Autor, David H., and Mark Duggan. 2003. “The Rise in the Disability Rolls and the Decline in Unemployment.” Quarterly Journal of Economics 118, pp. 157–206.
Board of Trustees of OASDI. 2013. “The 2013 Annual Report of the Board of Trustees of the Federal Old-Age and Survivors Insurance and Federal Disability Insurance Trust Funds,” May.
Burkhauser, Richard V., and Mary C. Daly. 2011. The Declining Work and Welfare of People with Disabilities: What Went Wrong and a Strategy for Change. Washington, DC: The American Enterprise Institute for Public Policy Research.
Burkhauser, Richard V., and Mary C. Daly. 2012. “Social Security Disability Insurance: Time for Fundamental Change.” Journal of Policy Analysis and Management 31(2), pp. 454–461.
Congressional Budget Office. 2012. “Policy Options for the Social Security Disability Insurance Program.”
Congressional Budget Office. 2013. “Social Security Trust Fund, May 2013 Baseline.”
Duggan, Mark, and Scott Imberman. 2009. “Why Are the Disability Rolls Skyrocketing? The Contribution of Population Characteristics, Economic Conditions, and Program Generosity.” In Health at Older Ages: The Causes and Consequences of Declining Disability among the Elderly, eds. David Cutler and David Wise. Chicago: University of Chicago Press.
Goss, Stephen. 2013. “Testimony by Stephen C. Goss, Chief Actuary, Social Security Administration before the House Committee on Ways and Means, Subcommittee on Social Security,” March 14.
Ruffing, Kathy A. 2012. “Social Security Disability Insurance Is Vital to Workers with Severe Impairments: Program’s Growth Largely Due to Demographic Factors; Financing Should Be Addressed as Part of Overall Solvency.” Center on Budget and Policy Priorities, August 9.
Rupp, Kalman, and David Stapleton. 1995. “Determinants of the Growth in the Social Security Administration’s Disability Programs: An Overview.” Social Security Bulletin 58(4), pp. 43–70.
Social Security Administration. 2012. Annual Statistical Supplement to the Social Security Bulletin.
Social Security Advisory Board. 2012. “Aspects of Disability Decision Making: Data and Materials,” February.
Stephens, Michael L., and Chelsea A. Thomas. 2011. “Short-Range Actuarial Projections of the Old-Age, Survivors, and Disability Insurance Program, 2010.” Social Security Administration, Office of the Chief Actuary, Actuarial Study 121 (June).
Opinions expressed in FRBSF Economic Letter do not necessarily reflect the views of the management of the Federal Reserve Bank of San Francisco or of the Board of Governors of the Federal Reserve System. This publication is edited by Anita Todd and Karen Barnes. Permission to reprint portions of articles or whole articles must be obtained in writing. Please send editorial comments and requests for reprint permission to research.library@sf.frb.org