Start-ups typically create jobs so fast at the beginning of recoveries that even a modest drop in that pace can affect the whole economy. In fact, slower job growth among new businesses may have resulted in 760,000 fewer jobs in the first year of the current recovery. Because housing wealth is an important factor in the financing of new businesses, lower house prices may have been partly to blame for the slower growth. Conversely, recently increasing house prices may already be boosting start-up growth and, with it, overall job growth.
Employment growth during the current recovery has been weak compared with past recoveries. It has taken nearly five years since the beginning of the economic expansion for nonfarm employment to return to its pre-recession peak. One factor that may have contributed to this tepid job growth is slower-than-normal employment growth at new businesses, or “start-ups.” Because start-ups generate jobs at a much faster pace than older businesses during recoveries, they account for a significant proportion of job growth in the economy, even though their share of overall employment is quite small. Therefore, even modest slowdowns in start-up growth could result in significant drops in overall employment growth.
Employment at start-ups was particularly hard-hit during the Great Recession, suffering a much steeper decline in growth compared with more mature businesses and compared with start-ups in previous recessions. One issue may have been financing. Because personal assets are an important source of funding for start-ups, the tumble in house prices during the downturn may have weakened start-up activity. Since house prices remained depressed early in the recovery, this Economic Letter examines whether start-up employment growth also remained depressed. We further consider whether the slower growth may have been a significant factor behind the weak job recovery.
We show that, compared with the recovery from the deep downturn of 1981–82, start-up employment grew significantly less in the year following the Great Recession. Our analysis suggests that between March 2010 and March 2011, lower employment growth at start-ups may have subtracted as much as 0.7 percentage point from total job growth, translating into roughly 760,000 fewer jobs.
Despite the weakness thus far in the recovery, recent increases in home values may bring better news, translating into greater financing opportunities for start-ups and, in turn, contributing to faster employment growth.
Start-ups during the Great Recession
Employment growth is linked to the size of a business, according to a large body of research. One important finding is that small businesses with few employees tend to grow faster than large businesses (see, for example, Birch 1987 and Neumark, Wall, and Zhang 2011). A recent refinement says that this relationship is largely due to the age of the firm (Haltiwanger, Jarmin, and Miranda 2013). Specifically, the negative relationship between firm size and employment growth is due to young start-up firms, which tend to be small as they start with very few employees. By contrast, older small businesses do not typically grow faster than larger firms.
We use the typical pattern of faster growth at younger firms to examine potential causes of slow job growth during the current recovery. We compare the annual net employment growth rate of start-ups and mature businesses over several economic expansions and contractions. Start-ups are defined as businesses less than five years old with fewer than 20 employees, and mature businesses are those at least five years old with 500 or more employees. Given that firms often create and eliminate jobs at the same time, we concentrate on net growth, the difference between the job creation rate and job destruction rate, throughout our analysis.
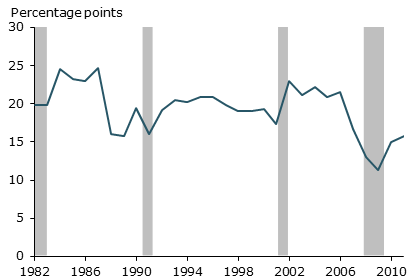
Figure 1 shows that employment growth among start-ups is 20 percentage points higher on average than for mature businesses. The figure also indicates that the difference between the two groups tends to shrink before or during economic downturns, shown by the gray bars. This drop was particularly pronounced in the period around the Great Recession.
Figure 1
Difference in growth rates, start-ups vs. mature firms

Source: BDS and authors’ calculations.
Note: Annual net employment growth of start-ups <5 years with <20 employees, minus annual net employment growth of mature firms, ≥5 years old with ≥500 employees.
The experience of start-ups in the Great Recession has been linked to the drop in house prices (Fort, Haltiwanger, and Jarmin 2013). In particular, U.S. states that experienced steeper declines in house prices also saw steeper declines in employment growth at start-ups relative to mature businesses.
A link between changes in house prices and start-up growth is intuitive. Lower house prices reduce homeowners’ equity and wealth, which can restrict an important source of funding that entrepreneurs typically access to start new businesses. In fact, the U.S. Census Bureau’s Survey of Business Owners shows that about seven out of ten businesses used personal or family assets for start-up funding. In turn, home equity constitutes 20–25% of households’ total assets on average. Lower home equity constrains the availability of home equity loans to fund start-ups. In addition, even entrepreneurs who use assets other than their home equity to start a new business may be less willing to take that risk if they don’t have enough home value as a backstop to their investment.
Start-up employment and the job recovery
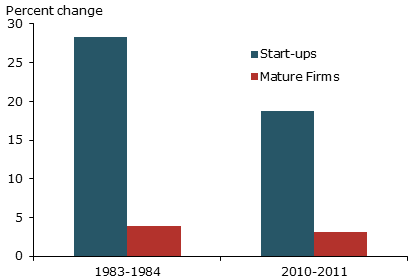
The effects of depressed house prices on start-ups during the recession may have continued into the early part of the recovery. To shed some light on this, we examine employment growth at start-ups and mature businesses during the recovery using data from the U.S. Census Bureau’s Business Dynamics Statistics (BDS) (see Schott 2013 for a model-based approach). The data track employment as of mid-March each year. Because data are released with a two-year delay, Figure 2 examines employment growth from March 2010 to March 2011, the first March-to-March period in the data that shows positive employment growth following the end of the Great Recession. To put these numbers in perspective, we compare them with values from the first March-to-March period of employment growth following the 1981–82 recession. We choose this comparison because, like the Great Recession, the 1981–82 recession was a deep downturn. The figure shows that, while employment growth at mature businesses was similar early on following the two recessions, start-up employment grew almost 10 percentage points less following the Great Recession. (See Laderman 2013 for an analysis of the relatively weak growth at both young and mature small businesses during the Great Recession.)
Figure 2
Net growth rates: Start-ups and mature firms

Source: BDS and authors’ calculations.
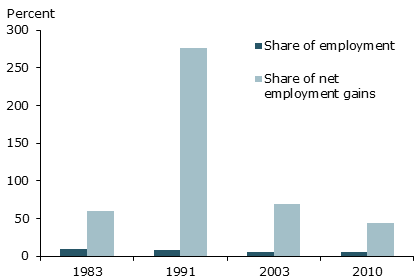
The weakness in employment growth at start-ups is likely an important factor behind the slow job growth in the economy as a whole. This is because start-up employment typically grows many times faster than employment at mature businesses in the early stages of recoveries, so that start-ups make outsized employment contributions relative to their small share of total employment. Figure 3 shows that start-ups typically account for roughly 50% of total job gains during recoveries. One exception was the recovery from the 1990–91 recession, when start-ups contributed net gains of more than 100%; this reflected declines in employment at all other businesses taken together.
Figure 3
Start-up share of employment gains in recoveries

Source: BDS and authors’ calculations.
Because start-ups add so many jobs early in recoveries, even modest slowdowns in the creation of new businesses could significantly reduce overall employment growth. To assess this effect on total job growth, we conduct a simple exercise, contrasting actual employment growth with what it might have been if start-ups had grown at an alternative, faster rate.
For this alternative, we choose the rate observed in the recovery from the deep 1981–82 recession shown in Figure 2. In the first year of growth following the employment trough, net start-up employment grew 28.3%. By contrast, in the first year after the lowest point of the 2007–09 recession, net start-up employment grew only 18.8%. If start-ups had grown at the higher rate, and if employment at all other firms had continued to grow at its actual pace, total employment growth between March 2010 and March 2011 would have been 2.3%, compared with an actual rate of about 1.6%. This would have translated into an additional 760,000 jobs.
A new tailwind?
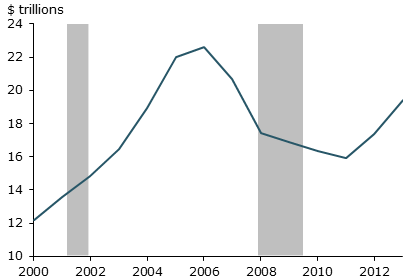
Although the housing market has cooled somewhat over the past year, house prices have increased substantially since their low point in 2012. Likewise, Figure 4 shows that homeowners’ equity started rising in 2012. These improvements may be good news for job growth. Just as low house values suppressed start-ups in the recession and early in the recovery, higher house prices may be pulling start-up growth back toward a faster pace and contributing to the higher rate of total job growth observed over the past year or so. As new data on start-ups become available, we will be able to test whether this conjecture holds true.
Figure 4
Home equity values rising

Sources: Federal Reserve Board and Haver Analytics.
Conclusion
Start-ups are an important engine of employment growth, particularly during economic recoveries. Low growth among start-ups at the beginning of the current recovery may have contributed to slow employment growth overall. Our simple exercise suggests that it may have lowered overall job growth by about 0.7 percentage point in the year following the Great Recession.
Although the weak performance of start-ups persisted longer than in past cycles, the situation may be improving. Over the past year or so, total employment growth has picked up. Gains in housing wealth, an important factor in the financing of new entrepreneurs, may be helping. And continued increases in home values should translate into even greater financing opportunities for new businesses and thus contribute to faster employment growth in the future.
Liz Laderman is an economist in the Economic Research Department of the Federal Reserve Bank of San Francisco.
Sylvain Leduc is a vice president in the Economic Research Department of the Federal Reserve Bank of San Francisco.
References
Birch, David. 1987. Job Creation in America: How Our Smallest Companies Put the Most People to Work. New York: Free Press.
Fort, Teresa, John Haltiwanger, Ron Jarmin, and Javier Miranda. 2013. “How Firms Respond to Business Cycles: The Role of Firm Age and Firm Size.” NBER working paper 19134.
Haltiwanger, John, Ron Jarmin, and Javier Miranda. 2013. “Who Creates Jobs? Small versus Large versus Young.” Review of Economics and Statistics 95(2), pp. 347–361.
Laderman, Elizabeth. 2013. “Small Businesses Hit Hard by Weak Job Gains.” FRBSF Economic Letter 2013-26.
Neumark, David, Brandon Wall, and Junfu Zhang. 2011. “Do Small Businesses Create More Jobs? New Evidence for the United States from the National Establishment Time Series.” Review of Economics and Statistics 93(1), pp. 16–29.
Schott, Immo. 2013. “Start-ups, House Prices, and the Jobless Recovery.” Unpublished manuscript.
Opinions expressed in FRBSF Economic Letter do not necessarily reflect the views of the management of the Federal Reserve Bank of San Francisco or of the Board of Governors of the Federal Reserve System. This publication is edited by Anita Todd and Karen Barnes. Permission to reprint portions of articles or whole articles must be obtained in writing. Please send editorial comments and requests for reprint permission to research.library@sf.frb.org